25

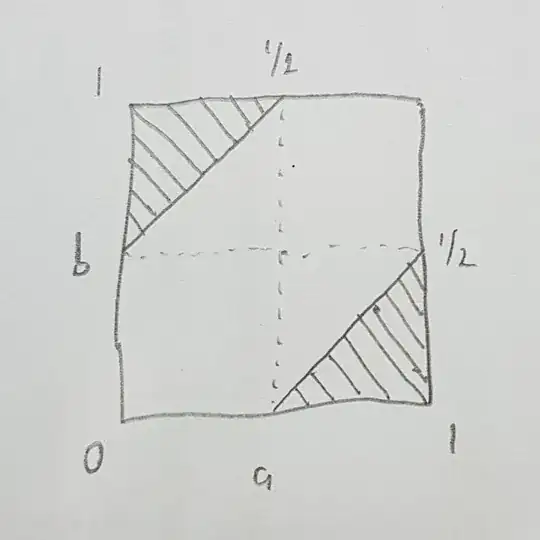
We have the unit interval $[0,1]$ and we want to find the probability of picking two random numbers $a,b$ from that interval with $|a-b|>0.5$.

Must I investigate $[0,1]×[0,1]$?

I don't have the faintest idea of how to solve this. The problem is that $[0,1]$ has infinite numbers to pick from… so how to calculate a probability with infinitely many items in the sample space?

I would be really happy if somebody shed a light on this.

Parcly Taxel
  • 105,904
  • 2
    I think you're using the word "possibility" where you want to use "probability". – G Tony Jacobs Feb 19 '18 at 14:55
  • 3
    $a,b$ follows what distribution? They are iid uniformly distributed on $[0,1]$? – GNUSupporter 8964民主女神 地下教會 Feb 19 '18 at 14:55
  • 1
    $|a-b|>0.5 \implies a > b+0.5$ or $a<b-0.5$. – Math Lover Feb 19 '18 at 14:55
  • @GTonyJacobs Yes, you right. – Konstantinos Nikoloutsos Feb 19 '18 at 14:56
  • 12
    Occam's razor is not infallible, but it suggests that if someone talks about choosing numbers "randomly" from an interval, without specifying a distribution, then they are probably thinking of the uniform distribution. Before I knew about different distributions, that's what I would have meant. – G Tony Jacobs Feb 19 '18 at 15:05
  • 1
    @KwnstantinosNikoloutsos it might help you to check the "Line Line Picking problem": I could be wrong but it seems to handle exactly that type of problem regarding the probability of the distance... http://mathworld.wolfram.com/LineLinePicking.html – iadvd Feb 20 '18 at 05:01
  • @Parcly: I know, you want a badge for an answer with 100 votes, and the way to get it is supposedly to keep this in the HNQ list. But your behavior now is just annoying. – Asaf Karagila Feb 20 '18 at 14:12
  • @AsafKaragila Congratulations for uncovering my hunches. Yet I believe the question has run its course. Therefore I will leave it as you did. (And I have other gold badges to chase.) – Parcly Taxel Feb 20 '18 at 14:13

3 Answers3

77

Quick, draw a diagram!

Since the two random variables are independent and uniformly distributed, the answer is clearly $\frac14$.

Parcly Taxel
  • 105,904
  • 1
    Thanks for providing the illustration that was missing from my answer! :) – G Tony Jacobs Feb 19 '18 at 14:55
  • 1
    It's worth noting that it's not stated that $a,b$ are uniformly distributed, but as long as they are independent, your approach will work with a slight modification in the integral. – GNUSupporter 8964民主女神 地下教會 Feb 19 '18 at 14:57
  • So if I have a problem with 3 random variables, then should I use a 3-dimensional cube? – Konstantinos Nikoloutsos Feb 19 '18 at 15:22
  • 2
    @KwnstantinosNikoloutsos Yes (as long as the variables are iid uniform). And so on for higher dimensions, though you'd be resorting to integration by then. – Parcly Taxel Feb 19 '18 at 15:23
  • @Parcly Taxel I love your "proof by picture". I always encourage picture drawing. What comes next is having the student draw the picture on the board and discussing why some points in [0, 1] x [0, 1] work and others don't. Vary the problem by making the "required distance" a parameter. Then discuss different "limiting behavior". Pictures like these open doors for a wide variety of topics from basic counting to calculus and the probability you'll land in between! – David Dyer Feb 26 '18 at 19:31
16

The geometric approach works well here. If you choose two points uniformly from the interval $[0,1]$, that's the same as choosing a point uniformly from the square with vertices $(0,0), (0,1), (1,0)$ and $(1,1)$. Now, you can graph the lines corresponding to the conditions $y=x+\frac12$ and $y=x-\frac12$. Between those lines are points where the difference between $x$ and $y$ is less than $\frac12$, and outside of them, you find points where the difference is greater. Use geometry to calculate the area inside your square of interest, but not between those two lines. That's your answer, since the total area of the square is $1$.

G Tony Jacobs
  • 32,044
  • 1
    I feel like this answer should be tacked onto the accepted one and you should both be considered as answerers. – user1717828 Feb 19 '18 at 17:43
  • 2
    It's funny: we answered nearly simultaneously. I understand the preference, though. Pictures are great when they can convey an idea so elegantly. The first time I saw such a demonstration, my mind was pleasantly blown. – G Tony Jacobs Feb 19 '18 at 17:44
13

Note: $$|a-b|>0.5 \Rightarrow a>b+0.5 \ \ \ \text{or} \ \ \ a<b-0.5.$$ Considering $0\le a,b\le 1$ we get: $$\begin{cases} b+0.5<a\le 1 \\ 0\le b<0.5 \end{cases} \ \ \ \text{or} \ \ \ \begin{cases} 0\le a <b-0.5 \\ 0.5<b\le 1\end{cases}.$$ We make up double integrals: $$P=\int_0^{0.5} \int_{b+0.5}^1 \mathrm{d}a \, \mathrm{d}b\color{red}{+}\int_{0.5}^1 \int_0^{b-0.5} \mathrm{d}a \, \mathrm{d}b=$$ $$\int_0^{0.5} (0.5-b)\, \mathrm{d}b \color{red}{+} \int_{0.5}^1 (b-0.5)\, \mathrm{d}b=$$ $$0.25-0.125 \color{red}{+} 0.5-0.125-0.5+0.25=0.25.$$

farruhota
  • 32,168
  • 1
    This generalises well to higher dimensions, but I think it's just simpler to draw a diagram when there are only $2$ variables, and the diagram is in 2D. – Toby Mak Feb 20 '18 at 04:59
  • 1
    @TobyMak, agreed the graphical method is easier to imagine, yet the algebraic method is also important (especially, for publishing in journals and for making it more rigorous). – farruhota Feb 20 '18 at 05:21