qutip mesolve gives me different population evolve depending on that initial state is state vector or density matrix. And, in some situation, it gives me negative population. It doesn't make sense...
Does anyone encounter this problem?
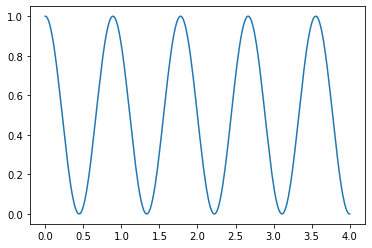
Population evolvement with State vector as initial state
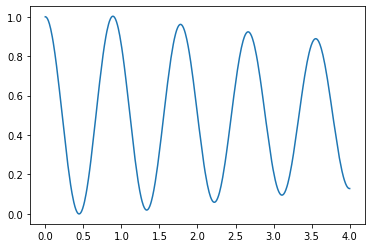
Pupulation evolvement with Density matrix as initial state
Here is my code: I'm just producing Rabi oscillation by applying microwave whose frequency is the difference between eigenenery[1] and eigenenergy[0].
import qutip as qt
import numpy as np
import matplotlib.pyplot as plt
Constants (G or us)
Sx, Sy, Sz = qt.jmat(1)
S0 = qt.qeye(3)
ge = 2 * np.pi * -2.8 # rad MHz/G
B = 60 # G
theta = 0 # degree
Bx = B * np.sin(np.pi * theta / 180)
Bz = B * np.cos(np.pi * theta / 180)
def H_GS():
    D = 2 * np.pi * 2870 # rad MHz
    H_D = D * (Sz*2 - 2/3  S0)
    H_B = ge * (Bx * Sx + Bz * Sz)
    H_GS = H_D + H_B
    return H_GS
ee, ev = H_GS().eigenstates()
def evolve_test():
    H_MW = ge * Sx
    def H_MW_coeff(t, args):
        omega = ee[1] - ee[0]
        Omega = 1/0.1/ge
        return Omega * np.cos(omega * t)
    H = [H_GS(), [H_MW, H_MW_coeff]]
    psi0 = qt.basis(3, 0)
    rho0 = qt.ket2dm(qt.basis(3, 0))
    rhoe = qt.ket2dm(qt.basis(3, 0))
    t = np.linspace(0, 4, 4 * 1000)
    result = qt.mesolve(H, rho0, t, progress_bar=True)
    states = result.states
    popm = [qt.expect(rhoe, state) for state in states]
    plt.plot(t, popm)
    plt.show()
    return 0
evolve_test()