Continuing on from my earlier question, I'm attempting to analyse the data qualitatively.
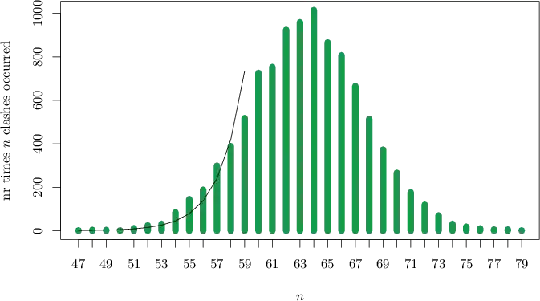
In the following plot, I make $10000$ samples where I count "the number of clashes". I plot $n$ vs. the number of times $n$ clashes occurred.
(The number of clashes is a measure of "how wrong" an attempted attack was [on the secret sharing scheme I'm looking at]).
(Drawn using tikzDevice for R, then edited manually.)
In R, it fails the shapiro.test, so it's not normally distributed:
> shapiro.test(z[1:5000])

    Shapiro-Wilk normality test

data:  z[1:5000]
W = 0.9947, p-value = 1.597e-12
So:
Q: How can I estimate the probability $p$ of $0$ clashes from the above distribution?
It should be very small, around $10^{-14}$:
- I have a theoretical lower bound of $1.046 \times 10^{-14}$, and I expect it to be close to the actual value.
- I have made $10^{11}$ samples, and all had at least one clash.
I attempted to fit an exponential curve to the left hand side (drawn above): the curve is $$3.29 \times 10^{-12} \exp(0.56n)$$ which, when $n=0$ gives the estimate $\hat{p}=3.29 \times 10^{-16}$. But I know that this estimate is off by around a factor of $100$, which makes me think this is not the best approach. (Or maybe I should fit some other curve, or use more samples. Or maybe this level of confidence is to be expected.)
Addendum:
I'm trying to show that $\mathrm{Pr}[0 \text{ clashes}]$ is small (say less than $10^{-8}$ or $10^{-9}$). So the estimate doesn't need to be precise, but I need to have confidence in the estimate.
The theoretical maximum number of clashes is $220$ (this number can be achieved).
"Do you know the statistical power of the Shapiro-Wilk test for such a large sample size?" In short, no, I don't. But we can compare the results to random data from a normal distribution:
> shapiro.test(rnorm(5000, mean = mean(z), sd = sd(z)))

    Shapiro-Wilk normality test

data:  rnorm(5000, mean = mean(z), sd = sd(z))
W = 0.9996, p-value = 0.4053
While the results fluctuate between runs, they don't seem comparable to my data.
I also tried with fewer samples included and it didn't seem to "help".
> shapiro.test(z[1:100])

    Shapiro-Wilk normality test

data:  z[1:100]
W = 0.9757, p-value = 0.06116
compared to
> shapiro.test(rnorm(100, mean = mean(z), sd = sd(z)))

    Shapiro-Wilk normality test

data:  rnorm(100, mean = mean(z), sd = sd(z))
W = 0.9845, p-value = 0.2932
(Here, it fluctuates quite a lot.)
I'm capable of making around $10^{10}$ samples, if it would help.