3

In two old statistics textbooks, I found the following pictures:- graphs of distributions 
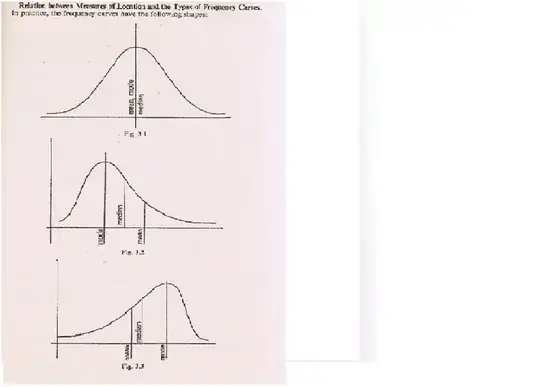
Without any explanation, they both inferred the following:-

When it is right skewed (as in fig. 3.2), mean > median. (And is the otherwise for the left skewed.)

  1. I wonder if the claim is always true?
  2. If it is, is there any simple proof? [By simple, I mean something like by inspection or simple logical reasoning but not deep into the statistical theory please.]
Micah
  • 38,733
Mick
  • 17,431

3 Answers3

1

This proof isn't quite right. Step 3 is a new assumption that doesn't follow from anything before. The mean-median=mode inequality is true for "nice" distributions, but you have to define nice more carefully than this proof does. The author gives the Gaussian as an example of a nice distribution, but the Gaussian has no skew. You might think the Weibull is a nice distribution, but the inequality doesn't hold for the Weibull.

Thee following article has a good discussion of violations, with citations that clarify the conditions under which the inequality is true.

  • Paul T. von Hippel. (2005). Mean, Median, and Skew: Correcting a Textbook Rule. Journal of Statistics Education, Volume 13, Number 2, jse.amstat.org/v13n2/vonhippel.html
1

This claim is false. Here's an interesting article on the subject: Mean, Median, and Skew: Correcting a Textbook Rule

Also note that you shouldn't confuse the terms skew with nonparametric skew, for which your claim is true by definition.

CyclotomicField
  • 11,925
  • 1
  • 14
  • 32
FiveLemon
  • 358
  • The link given provides a very good reference. A similar comment was just found in wikipedia (but not in that detail). It mentions that before 2005, there was indeed such a claim. It was later "proved" to be untrue especially for surprising frequencies. – Mick Oct 15 '13 at 05:39
1

While you have been given an answer that this is not always true, it is still true for some nice distributions, and one way to prove it by simple inspection is the following.

  1. The median $\nu$ means that the area under the distribution curve is equal at each side. $$\int_{-\infty}^\nu f(x)dx=\int_\nu^\infty f(x)dx$$
  2. When the graphic is skewed, the mood $\theta$ is in one of the sides and the graphic is overall taller at that side. Note: this is for nice gaussian-like distributions, distributions with irregularities or several peeks will not behave the same.

    Without loss of generalization let's say that $\theta>\nu$.

  3. So the mean $\mu_+$ in the taller side, is closer to the median than the mean $\mu_-$ in the shorter side: \begin{align}\mu_--\nu&=\int_{-\infty}^\nu(x-\nu)f(x)dx\\\mu_+-\nu&=\int_\nu^\infty(x-\nu)f(x)dx\end{align} So $\nu-\mu_->\mu_+-\nu$
  4. As the distribution have the same area, at each side of the median $\nu$, the overall mean $\mu$ is the arithmetic mean of $\mu_-$ and $\mu_+$. From the above we have:\begin{align}\nu-\mu_-&>\mu_+-\nu\\2\nu&>\mu_++\mu_-\\ \nu&>\frac{\mu_++\mu_-}{2}=\mu\end{align}
  5. So the mean $\mu$ is at the other side of the median $\nu$ than the mood $\theta$, either $\mu<\nu<\theta$ or $\theta<\nu<\mu$.

I hope this is what you were asking, and beware that not all distributions behave like this.

  • Eugenio Thomps That is a very good derivation. This is true only when the “distribution” is “nice” and smooth and without any surprising frequencies especially at the end(s). Right? – Mick Oct 15 '13 at 15:38