6

A sample $X_1,\dots,X_n$ is drawn from the normal distribution $N(\theta,\theta^2)$. I am asked to find a $90\%$ confidence interval for the population mean $\theta$.

Let $X_i\sim N(\theta,\theta^2)$ with $$\mathbb{E}(X_i)=\theta \text{ and } \mathbb{V}(X_i)=\theta^2$$ then the random variable $\bar{X}$ has $\mathbb{E}(\bar{X})=\theta \text{ and }\mathbb{V}(\bar{X})=\frac{\theta^2}{n}$ so, by virtue of the CLT we have that $$\bar{X}\sim N\Big(\theta,\frac{\theta^2}{n}\Big)$$ Now, standardizing we get $$\frac{\bar{X}-\theta}{\frac{\theta}{\sqrt{n}}}\sim N(0,1)$$ If we are asked to give a $90\%$ confidence interval for $\theta$ and we know that the $90\%$ confidence interval for a $N(0,1)$ is $$(-1.64,1.64)$$ we can see that $$-1.64<\frac{\bar{X}-\theta}{\frac{\theta}{\sqrt{n}}}<1.64$$ $$-\frac{1.64}{\sqrt{n}}<\frac{\bar{X}-\theta}{\theta}<\frac{1.64}{\sqrt{n}}$$ $$1-\frac{1.64}{\sqrt{n}}<\frac{\bar{X}}{\theta}<1+\frac{1.64}{\sqrt{n}}$$ $$\frac{1-\frac{1.64}{\sqrt{n}}}{\bar{X}}<\frac{1}{\theta}<\frac{1+\frac{1.64}{\sqrt{n}}}{\bar{X}}$$ $$\frac{\bar{X}}{1+\frac{1.64}{\sqrt{n}}}<\theta<\frac{\bar{X}}{1-\frac{1.64}{\sqrt{n}}}$$ is my confidence interval, right?

I wanted to be sure that my result was correct and so I wanted to know your oppinion. Have I done everything correctly? Thank you.

Amir
  • 11,124
Tutusaus
  • 667
  • Suppose $n=3$ and you observed the values $0,1,2$ and constructed a confidence interval for $\theta$; would you feel comfortable it being the same confidence interval as if you saw $-100,1,102$ since they have the same $\bar x$? – Henry Apr 05 '24 at 02:07
  • I just added an answer showing that the confidence interval obtained based on $S^2$ is better (@Henry) – Amir Apr 05 '24 at 13:23

2 Answers2

2
  1. The CLT is unnecessary to claim that $\bar{X} \sim \mathcal{N}\left(\theta, \dfrac{\theta^2}{n}\right)$ as $X_1, \ldots, X_n \sim \mathcal{N}(\theta, \theta^2)$
  2. Note that $$ 1 - \dfrac{1.64}{\sqrt{n}} < \dfrac{\bar{X}}{\theta} < 1 + \dfrac{1.64}{\sqrt{n}} $$ and $$ \dfrac{1 - \dfrac{1.64}{\sqrt{n}}}{\bar{X}} < \dfrac{1}{\theta} < \dfrac{1 + \dfrac{1.64}{\sqrt{n}}}{\bar{X}} $$ is not equivalent, if $\bar{X} < 0$.
  3. To solve this problem, there are other pivots that you can consider, i.e: $\dfrac{\bar{X} - \theta}{\frac{S_X}{\sqrt{n}}}$ which follows Student distribution, or, $\dfrac{(n - 1)S_X^2}{\theta^2}$ which follows Chi square distribution.

Edit. If we use the pivot $$ \dfrac{\bar{X} - \theta}{\frac{S_X}{\sqrt{n}}} \sim \text{Student}(n - 1) $$ Then, the $90\%$ confident interval for $\theta$ would be $$ \left[\bar{X} - t^n_{0.95}\dfrac{S_X}{\sqrt{n}}, \bar{X} + t^n_{0.95}\dfrac{S_X}{\sqrt{n}} \right] $$ where $t^n_{0.95}$ is a real number such that $\mathbb{P}(T \le t^n_{0.95}) = 0.95$ if $T \sim \text{Student}(n - 1)$.

If we use the pivot $$ \dfrac{(n - 1)S_X^2}{\theta^2} \sim \chi^2(n - 1) $$ then the $90\%$ confident interval for $\theta$ would be $$ \left[ \sqrt{\dfrac{(n - 1)S_X^2}{\chi^2_{0.95}(n - 1)}}, \sqrt{\dfrac{(n - 1)S_X^2}{\chi^2_{0.05}(n - 1)}} \right] $$ where $\chi^2_{\alpha}(n - 1)$ is a positive number such that $\mathbb{P}(X \le \chi^2_\alpha(n - 1)) = \alpha$, with $X \sim \chi^2(n - 1)$.

  • Your first point is true since if $X_i\sim N(\mu,\sigma^2)$ i.i.d then $\sum_{i=1}^{n}X_i\sim N(n\mu,n\sigma^2)$. For the second point, supposing that my sample was positive $x=(x_1,\dots,x_n)$ with $x_i\geq 0$ then my confidence interval would be okay, since $\bar{X}\geq 0$ right? It is true that my question does not say if my sample takes positive values, so in that sense I have to use the statistics which you have given me. If I want to consider the first one, what does $S_X$ mean? Is it the sample standard deviation? Which is the difference in putting this intead of $\theta$ like I did? – Tutusaus Apr 04 '24 at 10:31
  • I will try later to solve this like you said. If you would like to complete the question and construct the confidence interval asked I will be really appreciated and check-mark your answer. – Tutusaus Apr 04 '24 at 10:35
  • @HornyPigeon54 You don't assume a sample mean of a random sample from a normal distribution to be positive. Here is the output from R program, generate a random sample of size $5$ from $\mathcal{N}(1, 1)$: $$ -0.1956916,\ -0.2886542,\ -1.6976957,\ 0.9639958,\ 0.7366658 $$ Here $\bar{X} \approx -0.09627598$ – Thành Nguyễn Apr 04 '24 at 10:37
  • @HornyPigeon54 Updated. The confident interval for $\theta$ by using two statistics like I said – Thành Nguyễn Apr 04 '24 at 10:58
  • @ThànhNguyễn first of all thank you for spending your time to answer my question. I have looked at it and it makes sense to have this confidence intervals, but I am still stuck in understanding why if we know the "theoretical" variance (and so, the "theoretical" standard deviation) we still have to use another estimator other than $$\frac{\bar{X}-\theta}{\frac{\theta}{\sqrt{n}}}$$ This is a question which tries to understand the use of such an estimator not the way in which to find a confidence interval for $t^{n-1}$ or $\chi^{2}(n-1)$. – Tutusaus Apr 04 '24 at 19:01
2

First confidence interval based on sample mean

Considering that $\theta>0$, your confidence interval can be corrected as follows:

$$\color{red}{\small T_1=\max \left( 0,\frac{\overline{X}}{1+\frac{z_{\alpha/2}}{\sqrt{n}}} \right )<\theta<\\T_2=\frac{1}{\max \left( 1-\frac{z_{\alpha/2}}{\sqrt{n}},0 \right ) \max \left( \frac{1}{\overline{X}},0 \right )}},$$

where we adopt the convention that $\frac{1}{0}=\infty$. You should note that the CLT is not required here because for any sample size $n$ we have $$\overline{X}\sim \mathcal N\Big(\theta,\frac{\theta^2}{n}\Big).$$

A better interval is obtained in the following.

Remark: For small $n$, the confidence level of the above interval is greater than $1-\alpha$, that is,

$$\mathbb P \big ( (T_1,T_2)\ni \theta \big) \ge 1-\alpha. $$

Indeed, if $\overline{X}$ or $1-\frac{z_{\alpha/2}}{\sqrt{n}}$ is negative, then $T_2$ becomes $+\infty$, and we cannot retrieve from $(T_1,T_2)\ni \theta $ the first relation:

$$-z_{\alpha/2}\le \sqrt{n} \left ( \frac{\overline{X}}{\theta} -1 \right ) \le z_{\alpha/2}.$$

For negative $\overline{X}$, the resulting interval is $(0, \infty)$. $\overline{X}$ can be negative with probability $1-\Phi(\sqrt{n})$, which is almost $0$ for $n\ge 4$. Thus, for
$$n\ge \max \left (4, z_{\alpha/2}^2\right) $$ the confidence level is $1-\alpha$, i.e., $\mathbb P \big ( (T_1,T_2)\ni \theta \big) = 1-\alpha, $ and we can safely write:

$$T_1=\frac{\overline{X}}{1+\frac{z_{\alpha/2}}{\sqrt{n}}}, T_2=\frac{\overline{X}}{1-\frac{z_{\alpha/2}}{\sqrt{n}}}.$$

Second confidence interval based on sample variance

You can also obtain the following confidence interval:

$$\color{blue}{W_1=\left (\frac{(n-1)S^2}{\chi^2_{n-1,\alpha/2}} \right )^\frac{1}{2}<\theta < W_2=\left (\frac{(n-1)S^2}{\chi^2_{n-1,1-\alpha/2}} \right )^\frac{1}{2}}$$

using the fact that

$$\frac{(n-1)S^2}{\theta^2}\sim \chi^2_{n-1}$$

is a pivotal quantity for $\theta$.

Comparison and discussion

The second interval is better than the first in the sense that it has a smaller expected length, i.e.,

$$\mathbb E(W_2-W_1) \le \mathbb E(T_2-T_1).$$

For small $n$, if $\overline{X}$ or $1-\frac{z_{\alpha/2}}{\sqrt{n}}$ is negative, $T_2$ becomes $+\infty$, and consequently $\mathbb E(T_2-T_1)$ is $\infty$ for small $n$.

For $\alpha=0.05$, if $n\ge 4$, both$\overline{X}$ and $1-\frac{z_{\alpha/2}}{\sqrt{n}}$ are positive, and $\mathbb E(T_2-T_1)$ is finite, given by

$$P(n)=\mathbb E(T_2-T_1) = \underbrace{\mathbb E(\overline{X})}_{\theta}\left ( \frac{1}{1-\frac{z_{\alpha/2}}{\sqrt{n}}}-\frac{1}{1+\frac{z_{\alpha/2}}{\sqrt{n}}} \right).$$

We can also show

$$Q(n)=\mathbb E(W_2-W_1)=\underbrace{\mathbb E(S)}_{\frac{\sqrt{2}\Gamma \left ( \frac{n}{2} \right) }{\Gamma \left ( \frac{n-1}{2} \right)} \theta} \sqrt{n-1} \left ( \frac{1}{\chi^2_{n-1,1-\alpha/2}} - \frac{1}{\chi^2_{n-1,\alpha/2}}\right).$$

Now we compare $P(n)$ with $Q(n)$. In the following table, you can see values of $A(n)=\frac{P(n)}{\theta}$ and $B(n)=\frac{Q(n)}{\theta}$ for different sample sizes, which shows that the expected length of the second is significantly smaller and it rapidly tends to $0$.

$\hspace{3cm}$ enter image description here

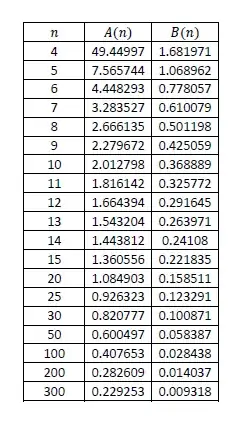
Finally, note that the statistics $\overline{X^2}$ and $\overline{X}$ are minimally sufficient for the distribution $\mathcal N\Big(\theta,\theta^2\Big)$ (see here and here). Hence, we may be able to design better confidence intervals based on some clever combinations of the two statistics $\overline{X^2}$ and $\overline{X}$. In fact, the sample variance $S^2$ can be considered such a combination by noting that

$$S^2=\frac{n}{n-1} \left( \overline{X^2} - \overline{X}^2 \right).$$

The above analysis shows that only using $\overline{X}$ yields a weak interval, which is not the case when $\sigma^2$ is known since $\overline{X}$ is sufficient for $\mathcal N\Big(\theta,\sigma^2\Big)$ with known $\sigma^2$.

Amir
  • 11,124