Suppose $A$ is a $d\times d$ matrix with IID standard normal entries.
Plots below compare value of $f(AA^TAA^TAA^TAA^T)$ and $f(AAAAA^TA^TA^TA^T)$ using 3 standard Schatten norms for $f$ and the former is consistently larger, why? 
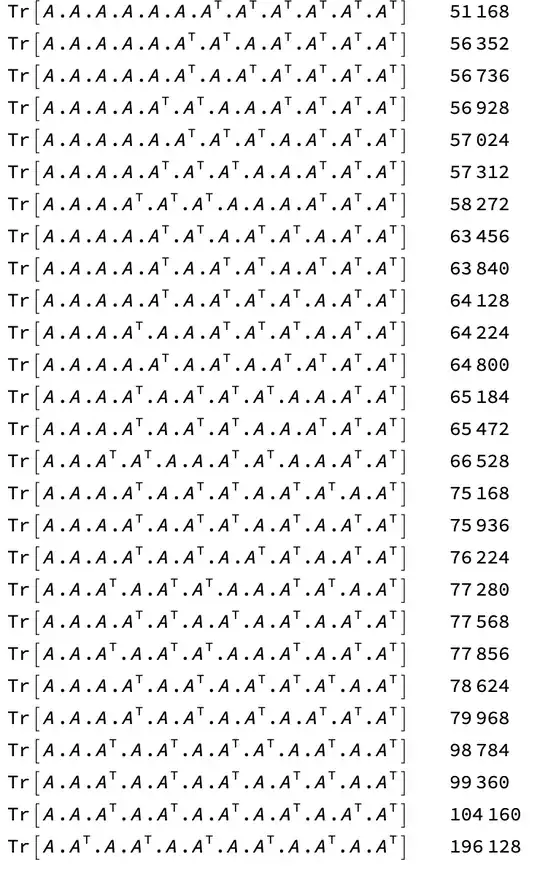
Furthermore, we can compute expected values of $Tr(A\ldots)$ for $d=2$ and various permutations of $A$, and these two forms appear to be the extreme values. What's the easiest way to explain this?
getVal[d_, f_, sampler_] := (
   A = sampler[d];
   {Norm[
     A . A\[Transpose] . A . A\[Transpose] . A . A\[Transpose] . A .
      A\[Transpose]],
    Norm[A . A . A . A . A\[Transpose] . A\[Transpose] .
      A\[Transpose] . A\[Transpose]]}
   );
dvals = Range[100, 200, 10];
funcs = {Norm[#, "Frobenius"] &, Norm, Tr};
sf = "Log";
dec[pairSeq_] := {{dvals, pairSeq[[All, 1]]}\[Transpose], {dvals,
     pairSeq[[All, 2]]}\[Transpose]};
f = Norm;
plotFunc[f_, fname_, sampler_] := (
   ListLinePlot[dec[getVal[#, f, sampler] & /@ dvals],
    PlotLabel -> fname, AxesLabel -> {"d", "value"},
    PlotLegends -> {"f(AA'AA'AA'AA')", "f(AAAAA'A'A'A')"},
    ScalingFunctions -> "Log"]
   );
randNormal[d_] := RandomVariate[NormalDistribution[], {d, d}];
randUniform[d_] := RandomVariate[UniformDistribution[], {d, d}];
randBernoulli[d_] :=
  N@RandomVariate[BernoulliDistribution[0.5], {d, d}];
sampler = randNormal;
TableForm[{{plotFunc[Norm, "f(A)=||A||", sampler],
    plotFunc[Tr, "f(A)=Tr(A)", sampler],
    plotFunc[Norm[#, "Frobenius"] &,
     "f(A)=||A!(*SubscriptBox[(||), (F)])",
     sampler]}}[Transpose]]
