Let's have a random sample of points in an euclidean $n$-space: assume a iid sample from a standard normal distribution.
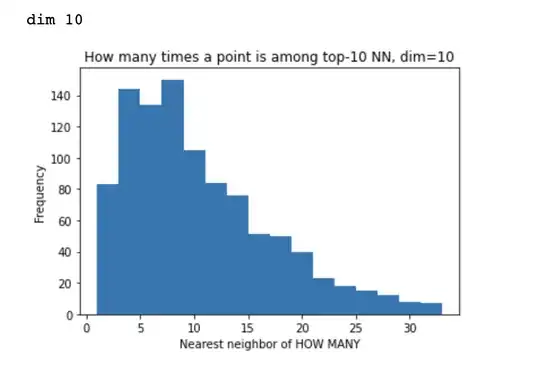
To each point $p$, I assign the number $N(p)$ defined as "how many times does $p$ occur in $10$ nearest neighbors of some other point"?
I would like to understand the distribution of $N(p)$ and how it depends on dimension.
Some experimental results from python are quite surprising to me. In low dimensions, for $n=2,3,4$ this distribution is close to normal, while in higher dimensions it's very skewed, with most point being no nearest neighbours to anything else, and a few points being nearest neighbours to a lot of other points.
I always generate 1000 exampels here (not that it matters), here are some histograms:


I have some intuition / idea that the relation with dimension may boil down to something like this:
- in dim $1$, a point can be nearest neighbor of at most 2 points, one on the left and one on the right
- in dim $2$, a point can be nearest neighbor of 5 or 6 points, forming a regualr hexagon around it and so on.
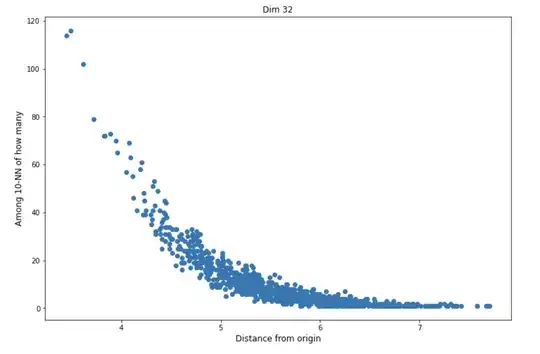
I also checked if those points that are NN of many other points are more like in cluster center -- which is intuitively expected. The answer is yes, here is an example in dimension 32:
However, I'm not sure why is the dependency on dimension so crucial?
The motivation comes from searching for nearest neighbours where the data represent some real objects, and nearest neighbours represent search of a user.
Should I use rather smaller dimension, if I want to support the idea that each element should get a chance of being found?
Thanks for any insight.