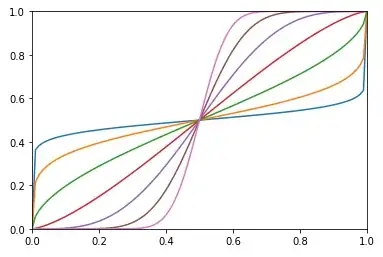
Here is a fully configurable sigmoid function. I post the full code, try the plotting option. I add furthermore two other functions derivated from the sigmoid, just in case:
def sigmosym(x, Lambda = 0.5, mirror = False, plotting = False):
    # Symetric sigmoid function f from [0 1] to [0 1], with the
    # property that f(0) = 0, f(1) = 1, f'(0) = f'(1) = 0, and f is
    # symetric about the point (1/2, 1/2).
    # If mirror is set to True, then sigmosym returns 1 - f.
    #
    # INPUT:
    #   * x: a scalar
    #   * Lambda (default 1): a real number > 0; if lambda <=1, then
    #          the sigmoid is convex at the first half of the curve, and
    #          concave at the second half, that is, it has only one
    #          inflexion point; if Lambda >1, it will be concave between 0 and
    #          1/2 and convex between 1/2 and 1, with 4 inflexion points,
    #          extending to the horizontal around the center.
    #   * mirror (default False): if set to True, then the function returns
    #     1-f, where f is the function returned if mirror = False
    #   * plotting (default False): if set to True, the function is plotted,
    #     and no value is returned.

    if plotting:
        import matplotlib.pyplot as plt
        x = list(np.arange(0, 1, 0.01))
        y = [sigmosym(t, Lambda, mirror = mirror, plotting = False) for t in x]
        fig1 = plt.figure()
        ax = fig1.add_subplot(1,1,1)
        ax.grid(True)
        ax.plot(x, y)
        return None

    f = 2 * np.abs(x) - 1;
    f = (np.sign(f) * (np.abs(f)**Lambda) + 1) / 2
    f = np.sin(np.pi * f/2)**2
    if mirror:
        f = 1 - f

    return f


def sigmocurve(x, stiffness = 0.5, inflexion = 1,
                                   mirror = False, plotting = False):
    # A positive sigmoidal function f extending from 0 to +infty, with the
    # property that f(0) = f'(0) = 0 = f'(+inf), f(+inf) = 1,
    # f is convex between 0 and a point x_infl very near to "inflexion", f is
    # concave between x_infl and +inf.
    # If mirror is set to True, then sigmocurve returns 1 - f.
    #
    # INPUT:
    #   * x: a scalar
    #   * stiffness (default 0.5): a real number between 0 and 1 (>0, <= 1):
    #     the more "stiffness" is close to 0, the more abrubtly the function
    #     climbs from x_infl to 1.
    #   * inflexion: the approximative inflexion point of the curve, that
    #     is, the point where the curve climbs to upper_bound; "inflexion"
    #     must be > 0.
    #   * mirror (default False): if set to True, then the function returns
    #     1-f, where f is the function returned if mirror = False
    #   * plotting (default False): if set to True, the function is plotted,
    #     and no value is returned.
    #

    if plotting:
        import matplotlib.pyplot as plt
        intvl = 60
        x = list(np.arange(0, intvl, 0.01))
        y = [sigmocurve(t, stiffness = stiffness, inflexion = inflexion,
                          mirror = mirror, plotting = False) for t in x]
        fig2 = plt.figure()
        ax = fig2.add_subplot(1,1,1)
        ax.plot(x, y)
        ax.grid(True)

        return None

    a_infl = 1/inflexion
    t = a_infl * x / (1 + a_infl * x)
    f = sigmosym(t, stiffness, mirror = False)
    if mirror:
        f = 1 - f

    return f


def sigmobell(x, mu = 0, sigma = 1, Lambda = 1, plotting = False):
    # A bell shaped sygmoid based function f with center mu, and extent sigma
    # (it is 0 outside of [mu-sigma, mu+ sigma]). f is symmetrical about mu,
    # and reach its maximum f = 1 at x = mu. The two halves of the bell are
    # built using the sygmosym function.
    #
    # INPUT:
    #   * x : a scalar
    #   * mu : the center of the bell (default 0)
    #   * sigma: a number > 0 the radius of the bell (default 1)
    #   * Lambda: a number between 0 and 1, that controls the shape of
    #     the bell (default 1): the more Lambda is close to 0, the more
    #     the bell resembles to a rectangle, and the more it is close
    #     to 1, the more it resembles a well shaped bell.
    #   * plotting (default False): if set to True, the function is plotted,
    #     and no value is returned.
    #
    if plotting:
        import matplotlib.pyplot as plt
        x = list(np.arange(mu - sigma - 1, mu + sigma + 1, 0.01))
        y = [sigmobell(t, mu = mu, sigma = sigma, Lambda = Lambda,
                                       plotting = False) for t in x]
        fig3 = plt.figure()
        ax = fig3.add_subplot(1,1,1)
        ax.grid(True)
        ax.plot(x, y)
        return None

    Delta = (x - mu) / sigma
    if np.abs(Delta) > 1:
        Delta = 1
    f = 1 - sigmosym(Delta, Lambda = Lambda, mirror = False)

    return f


if __name__ == '__main__': # PLOT THE FUNCTIONS FOR SOME PARAMETERS


    sigmosym(None, Lambda = 0.5, mirror = False, plotting = True)

    sigmocurve(None, stiffness = 0.2, inflexion = 12,
                                   mirror = False, plotting = True)

    sigmobell(None, mu = 0, sigma = 2, Lambda = 1, plotting = True)

    plt.show()