There are lots of discussions on the web about Principal Component Analysis (PCA) and how to use tools such as matlab octave for that. However none of them fit my problem.
My problem is that I have a set of 1D observations and when I want to plot the data points in a 2D XY chart, the X axis are the indices of the observations (integer numbers) and the Y axis is the value of observations. For example, my observations are
0.7 0.4 0.55 0.2 0.63 0.83 0.48 0.91 0.73
Now when I use princomp in octave, I get this result
octave:8> X = [0.7 0.4 0.55 0.2 0.63 0.83 0.48 0.91 0.73];
octave:9> [pc, z, w, Tsq] = princomp (X)
warning: XXX FIXME XXX Tsq return from princomp fails some tests
pc =  1
z =

   0.096667  -0.203333  -0.053333  -0.403333   0.026667   0.226667  -0.123333   0.306667   0.126667

w =  0.049200
Tsq =  8
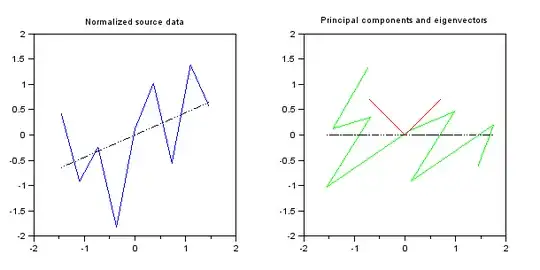
What does that mean? I want to see two axis which show the directions of variances.
UPDATE
Baseed on what Gottfried Helms said, Ichanged my input to
octave:1> X=[1 0.7; 2 0.4; 3 0.55; 4 0.2; 5 0.63; 6 0.83; 7 0.48; 8 0.91; 9 0.73];
and here is what i get
 octave:5> [pc,score,l,t] = princomp(X)
 warning: XXX FIXME XXX Tsq return from princomp fails some tests
 pc =

    -0.999358  -0.035833
    -0.035833   0.999358

 score =

    3.9940e+00   2.3994e-01
    3.0054e+00  -9.5704e-02
    2.0006e+00   1.8367e-02
    1.0138e+00  -3.6724e-01
   -9.5555e-04   2.6650e-02
   -1.0075e+00   1.9069e-01
   -1.9943e+00  -1.9492e-01
   -3.0091e+00   1.9897e-01
   -4.0020e+00  -1.6747e-02

 l =

    7.509591
    0.039609

 t =

    3.577651
    1.433997
    0.541503
    3.541846
    0.017931
    1.053196
    1.488853
    2.205235
    2.139788
Now how can I plot the two lines which show the direction?