7

https://www.desmos.com/calculator/6hfyqc6ks9

Did I just create a fractal? Again, the function is $\frac{\max(1,xy)}{y} = x$.

Here's what it looks like on Desmos

Here's what it looks like on WolframAlpha

Even uncannier version, from the alternative form with "sgn" that Wolfram provided: https://www.desmos.com/calculator/rikex4bvld

Josh
  • 477
  • 1
    Pretty cool Josh. How do you know that it’s fractal? – shawn_halayka Jan 06 '22 at 02:27
  • 1
    Not sure if it's mathematically correct, though. Could it just be that I tricked Desmos into attempting to plot all real numbers on the coordinate plane or something, and what I'm seeing right now is simply a memory issue? Because if $xy > 1$ and $y \ne 0$, then I'm pretty sure this would just simplify to $x = x$. – Josh Jan 06 '22 at 02:28
  • Hmmm. Your guess is as good as mine. Try it on wolframalpha.com? – shawn_halayka Jan 06 '22 at 02:29
  • 1
    It looks like the equation should be true if $xy\geq 1.$ Not sure why Desmos graphs it the way it does. – Thomas Andrews Jan 06 '22 at 02:30
  • Now see. Yeah, I'm almost certain that this is not mathematically correct, because multiplying both sides by y and graphing $\max(1,xy) = xy$ simply produces the graph of $y = \frac{1}{x}$. – Josh Jan 06 '22 at 02:30
  • Thomas, what is "beq"? I'm assuming it's a typo for "not equals to"? – Josh Jan 06 '22 at 02:31
  • Always wait a moment for edits, since we can’t see MathJax errors until after we post. – Thomas Andrews Jan 06 '22 at 02:32
  • Sorry about that. My bad. – Josh Jan 06 '22 at 02:33
  • 2
    The repeating pattern occurs between powers of two. This leads me to guess that this is a floating point issue, and not directly related to the equation – Calvin Khor Jan 06 '22 at 02:33
  • Why, shawn, I tried it on WolframAlpha and it's also a hot mess. – Josh Jan 06 '22 at 02:34
  • Added pictures for convenience's sake. – Josh Jan 06 '22 at 02:37
  • Ok. Well, you’ve stumbled upon a fractal pattern of some kind, perhaps. Whether it’s new or not is not part of my knowledge. Best of luck to you. – shawn_halayka Jan 06 '22 at 02:39
  • 1
    What is your definition of "fractal"? In the mathematical literature, the term remains undefined (Mandelbrot proposed a definition 40 years ago, but abandoned it pretty quickly when it failed to capture the kinds of objects which were of interest). And even if the answer is "yes", what next? Simply labeling something "fractal" doesn't actually tell you very much. What is the next step? What do you get by determining whether or not it is fractal? – Xander Henderson Jan 13 '22 at 22:37

2 Answers2

10

You have definitely created a strange fractal-like behavior, but not in the equation itself -- rather in Desmos's plotting software :)

The problem with this equation is that it is true not for a one-dimensional curve of points, but rather for the two-dimensional space of points $(x,y)$ where $xy \ge 1$. Algebraically: $$ 
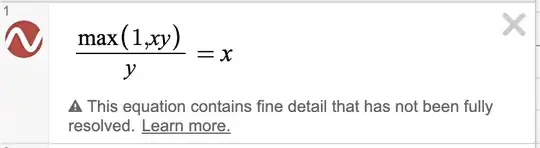
\frac{\max(1, xy)}{y} = x \iff \max(1, xy) = xy \iff xy \ge 1. $$

The true plot of this is as follows:

enter image description here

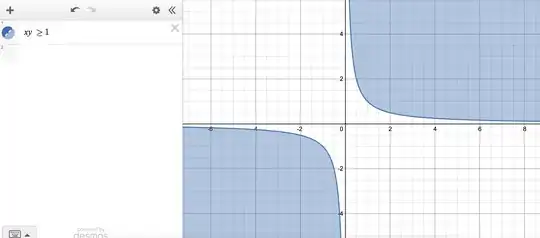
Graphing software -- including Desmos -- is usually optimized for the case of plotting a curve, rather than a 2-dimensional space of points. It is likely that is the reason for the weird behavior.

FWIW, Desmos does warn us that something might be up with this plot, as shown by the following warning in your screenshot:

enter image description here

5

I have identified the regions as being delimited by powers of $2$ and graphs of $y=2^k/x$. The issue is with the implementation of their max function. If you change it to $\max(0,xy)/y=x$, you can extend the pattern all the way down to the origin: Desmos link enter image description here The clean lines make up the true "fractal". But I think this is the end of the line for me, because I have no idea why max would have an issue understanding that if $a\approx 2,b\approx 2$ then clearly, $\max(ab,0)=ab$.

Calvin Khor
  • 36,192
  • 6
  • 47
  • 102