4

Imagine I generate $N$ real numbers with a uniform distribution between $0$ and $1$. I sort them in ascending order. And I calculate the differences between each consecutive pair.

For example, for $N = 3$, it would be like this:
enter image description here

I would like to know what is the expected value of that differences, $\Delta$. Each pair will have a different $\Delta$ but I'm just interested on the average expected value of all $\Delta$.

As I don't know how to calculate it with equations I've done it with a simulation instead (I'm not mathematician nor statistician, I just work with computers). And what I've gotten is: if I have $N$ numbers the average distance between them is $\frac1{1+N}$, and that's also the value between the first number and zero.

I would like to know how to calculate this with equations. Intuitively I think it's the same as calculating $E\left[|X_i-X_j|\right]$ where $X_i$ and $X_j$ are two neighboring numbers in that sample.

In general the expected value is calculated as: $$E[X]=\int_{-\infty}^\infty xf(x)\,dx$$

I think here we should integrate $|X_i-X_j|$ but I don't know $f(x)$, the distribution of the differences, because I can't assume they are independent because we have to sort them and take the nearest pairs. And the absolute value complicates calculations a little bit more.

There is an apparently similar question here but they are speaking about the minimum distance among all pairs.

StubbornAtom
  • 17,932
skan
  • 401
  • It seems you need the distribition of the difference; data distribution is given, can't you take the derivative of the data distribution as the required distribution? – Creator Jan 27 '20 at 22:22
  • Are you thinking about relating the increment with the derivative? But that will only work when N -> ∞. And in my example I'm speaking about a small N. – skan Jan 27 '20 at 23:31

4 Answers4

3

Since there are $N+1$ subintervals and their lengths add to $1$, the average subinterval length is $\frac{1}{N+1}$.

paw88789
  • 41,907
2

It can be proven that the expected value of the $k$-th smallest number is $\frac{k}{n+1}$ (it has a $B(k,n+1-k)$ distribution). By linearity of expectation we have: $$\mathbb{E}[X_{i+1}-X_i]=\frac{i+1}{n+1}-\frac{i}{n+1}=\frac{1}{n+1}$$ We can give a simple proof of the assertion at the beginning as follows: imagine that we sample an additional point, let's call it $X$, from the same distribution independently of all the others. The expected value in question is equal to the probability that this point will be smaller than $k$-th smallest number not counting $X$ i.e. will be on position $1$, $2$, ..., $k$ when $X$ is counted. But since there are $n+1$ points and each position of $X$ is equally likely this probability is simply $\frac{k}{n+1}$ as expected.

Bartek
  • 2,575
2

Here's a somewhat more roundabout way of obtaining the result, assuming the originally chosen numbers $\ Y_1, Y_2, \dots, Y_N\ $ are independent.

The arithmetic mean difference between the ordered numbers is $\ \Delta=\frac{\sum_\limits{i=1}^{N-1} \left(X_{i+1}-X_i\right)}{N-1}=\frac{X_N-X_1}{N-1}\ $, and the joint distribution of $\ X_1, X_N\ $ can be calculated from \begin{align} P\left(a\le X_1, X_N\le b\right)&=P\left(a\le Y_1,Y_2,\dots,Y_N\le b\right)\\ &=\cases{\left(\min(b,1)-\max(a,0)\right)^N& if $\ b>\max(a,0) $\\ 0& otherwise} \end{align} and \begin{align} P\left(X_N\le b\right)&=P\left(Y_1,Y_2,\dots,Y_N\le b\right)\\ &=\cases{\min(b,1)^N&if $\ b>0$\\ 0& otherwise} \end{align} since \begin{align} P \left(X_1\le a, X_N\le b\right)&= P\left(X_N\le b\right)-P\left(a\le X_1, X_N\le b\right)\\ &=\cases{\min(b,1)^N-\left(\min(b,1)-\max(a,0)\right)^N & if $\ b>\max(a,0) $\\ 0&otherwise} \end{align} The joint density function $\ f(x,y)\ $ of $\ X_1,X_N\ $ is therefore given by \begin{align} f(x,y)&=\cases{N(N-1)\left(\min(y,1)-\max(x,0)\right)^{N-2}& if $\ y>\max(x,0)$\\ 0& otherwise} \end{align} and the expectation $\ E(\Delta)\ $ of $\ \Delta\ $ by \begin{align} E(\Delta)&=\int_0^1\int_x^1\frac{y-x}{N-1}\cdot N(N-1)(y-x)^{N-2}dydx\\ &= N\int_0^1\int_x^1(y-x)^{N-1}dydx\\ &=\int_0^1(1-x)^Ndx\\ &= \frac{1}{N+1} \end{align}

  • Why are you using two variables, X and Y? How are they related? – skan Jan 28 '20 at 17:31
  • What confused me is you started speaking about Y – skan Jan 30 '20 at 00:55
  • 1
    Oh, I'm sorry. $\ Y_1, Y_2, \dots, Y_N\ $ are just the uniformly distributed random numbers originally chosen before they were reordered to get $\ X_1, X_2,\dots, X_N\ $. For the derivation to work, the $\ Y$s have to be assumed independent, even though the $\ X$s won't be. In fact, the result won't necessarily be true if the $\ Y$s aren't independent. – lonza leggiera Jan 30 '20 at 01:03
1

Relabel $\Delta_i=X_{i+1}-X_i$ as $L_i$ with $1\le i<n$. The cumulative distribution function (CDF) of $L_1$ can be shown to be

$$f_{L_1}(l)=1-(1-l)^n\quad 0<l<1\tag{1}$$ where $n$ is the number of points ($f_{L_1}$ appropriately $0$ or $1$ outside its support). Its derivative is the probability distribution function (PDF): $$p_{L_1}(l)=n(1-l)^{n-1}\tag{2} $$

The average value is now easily obtained (via $\int_0^1 l\,p_{L_1}(l) dl$)$$E[L_i]=\frac{1}{n+1}\tag{3}$$

Note that in the above equations, the right hand sides (RHS) are independent of the index $i$ implying that the distribution is identical for all $L_i$. This is borne out in the derivation of eqn. $1$.

Derivation

First we consider the simpler case of $n=2$. As seen in fig. 1, the sorting process compresses the sample space into half, doubling the probability density from that of the unsorted points. Hence $P[X_1=x_1 \land X_2=x_2 \land X_1<X_2 ]=p_{X_1,X_2}(x_1,x_2)dx_1dx_2=2dx_1dx_2.$ For the predicate $L_1<l$, the probability is given by the integral of the joint PDF of the sorted $X_i$ ($=2$) over the region enclosed within the lines $X_2-X_1=0$ and $X_2-X1=l$ (and of course the boundaries $X_1=0$ and $X_2=1$). Fig. 1 shows this region for $l=0.4$.

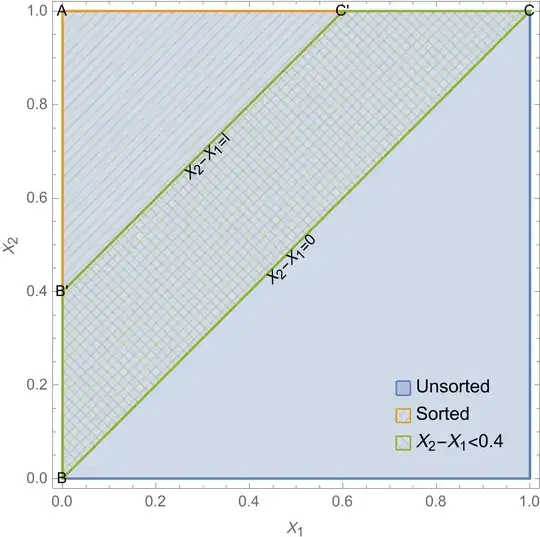
fig 1: Plot showing the sample space before (in blue) and after sorting (in orange). Also is shown the sample space for $L_1<0.4$ (in green).

The area of this region ($BB'C'C$) is calculable via observing that the line $X_2-X_1=l$ is parallel to the line $X2-X1=0$. Clearly, $\triangle AB'C' \sim \triangle ABC$. Hence the ratio of their areas is $((1-l)/1)^2$ and so the region $BB'C'C$'s area is $1-(1-l)^2$ times the area of $\triangle ABC$, which itself if $1/2$ of the unsorted sample space's area.

Now $P[L_1<l]=f_{L_1}(l)=\int_{BB'C'C}p_{X1,X2}(x1,x2)dx_1 dx_2$. Since, $p_{X1,X2}=2$ is a constant, the integral simplifies to eqn. $1$.

For higher $n$, the calculation is similar but in $n$ dimensions. The sorted sample space given by the polytope $0<X_1<X_2<\ldots<X_n<1$ has an $n$-dimensional volume $1/n!$ while the joint PDF is $n!$. For a given $l$, similar to before, the $n$-dimensional volume of the region satisfying $P[L_1<l]$ is given by $1-(1-l)^n$ time that of the (sorted) polytope, thus simplifying exactly as before to eqn. $1$. Note that it doesn't depend on $X_1$ or $X_2$. Since this applies to any $L_i$, all $L_i$s have the same distribution.

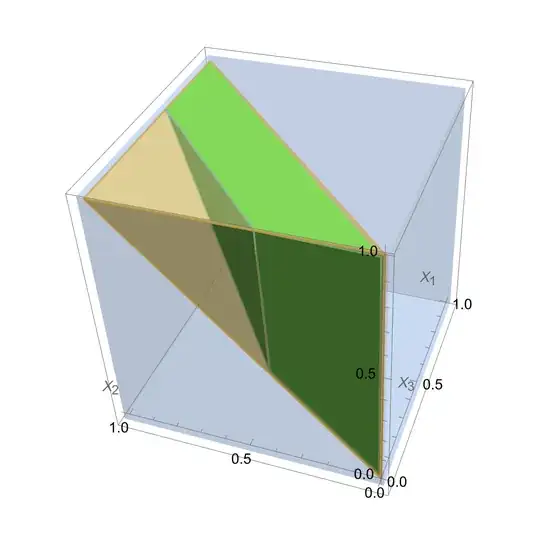
fig. 2: Figure showing unsorted sample space (blue cube), sorted sample space (tetrahedron in orange) and the phase space for $L_1<0.4$ (green frustum) for $n=3$. As $l$ is increased to $1$, the frustum fills the sorted sample space, its 'top' surface ($X_2-X_1=l$) moving towards the 'apex' $(0,1,1)$. Axes $X_1,X_2,X_3$ form a right handed coordinate system.

lineage
  • 374
  • 1
  • 10