Since I am not very mathematically inclined, I can only do computer simulation to first try simple paths, then slowly try more sophisticated paths. My computer simulation will just pick $2$ random positions for the walls if they are present based on their probabilities. There are $5$ main cases to handle for this problem... $1$) no wall, $2$) small wall only, $3$) large wall only, $4$) small wall before large wall, $5$) large wall before small wall. I will be doing a simulation of this breaking it into these $5$ cases.
Also, if you attempt to always walk directly at B (except when you are walking around a wall) and both walls are present, I calculated (by hand) that the worst case with the small wall close to $0.5$ mile marker and large wall close to $1.5$ mile marker causes a walk distance of about $4.1$ miles. (someone please check this). The $5$ walks segments lengths (in order) are: $.5$, $.25$, $1.275$, $.958$, $1.118$ for a total of $4.101$ miles (more than double the direct path when no walls are present).
Also worth mentioning is the "pessimistic path" which circumvents the walls in all cases by using a slope of $2$ in the first half mile, holding y=$1$ for the middle mile, the dropping back down to B with a slope of $-2$. This path is about $3.24$ miles.
Slightly better than this "pessimistic path" might be to instead hold y=$0.99$ instead of y=$1$, so that if the large wall is encountered, we will know where it is and can then adjust our path more directly towards B.
Another possible strategy is to "play the probabilities". It would involve figuring out what is the chance of the large wall showing up first, and then aiming up that percentage of its uplength. Problem is you don't know where it will be until you hit it so maybe pick the middle spot of mile marker $1$ initially and see what happens. That is, from A, immediately slope up to (1, P(large wall encountered first)). Both units being in miles. This will almost certainly not be optimal but is a decent strategy for simulation cuz it is simple and it considers the larger wall.
Another "simple" strategy is to figure out a good slope for the extremes (large wall at mile $0.51$ and large wall at mile $1.49$ and pick some intermediate slope. I doubt that would go much above y=$0.5$.
If someone has a possible solution to a minimal walk path but doesn't want to type in all of their solution cuz it is time consuming, just enter a table of x,y values from x = $0$ to $2$ in $0.1$ steps.
$UPDATE~~1$ - I wrote the simulation program for the simple strategy that always tries to walk directly towards B but still having to go around any walls. I broke this up into $4$ subcases as follows:
Case $1$: Small wall only. I get an average walk distance of $2.6262$.
Case $2$: Large wall only. I get an average walk distance of $3.4293$.
Case $3$: Both walls. I get an average walk distance of $3.5181$.
Case $4$: no walls. Average walk distance is $2.0000$.
Remember cases $1$ and $3$ each only happen $12.5$% of the time, while cases $2$ and $4$ both each happen $37.5$% of the time , so the weighted average yields an average walk length of $2.804$ miles which is consistent with my other "Monte Carlo" type simulation. This one busts up the middle mile into $999$ equidistant pieces so I am simulating possible wall positions every $5.28$ feet. The walls in my simulation can be at mile markers $.501$, $.502$... $1.498$, $1.499$ but never at $0.5$ and never at $1.5$.
Runtime, (using an interpreted language), is about $1.5$ seconds.
$UPDATE~~2$ - My first effort to beat the simple always try to aim at B strategy worked but was kinda slow on my computer. I just picked $3$ variable slopes, one for each half mile segment. The $4$th slope is a given it just aims back down to B. I gave the $3$ slopes "liberty" like from $0.1$ to $1.0$ for the first $2$. I suspected the optimal shape would be a curve so I allowed the program to slope back down for the $3$rd slope (but still investigated some upslopes too for that segment). When I got the general shape of the curve via the $3$ "ballpark" slopes (not yet optimal), then I tightened the range on the slopes but with more precision. This seemed to almost work but since it was a Monte Carlo type simulation with random values, problem was I was not getting the same results each run. I could somehow change the simulation to be more like my direct at B simulation where I walk each subcase with all possible wall positions and then just assign a weight to those cases then come up with an overall weighted average which works, but requires some accurate programming. This problem is pretty impressive in that shortcuts will get you close but then someone else more sophisticated with better tools can come along and get a better answer. It is also impressive in that the math and simulation required is advanced, yet conceptually the problem is easy to understand (for example a child could likely understand the problem but not likely solve it).
$UPDATE~~3$ - I have an idea I will be pursuing. For simulation, the optimal solution is somewhat elusive cuz it would require walking virtually all possible paths (within reason) and that takes too much computational time. If however, I can just pick a reasonable number of slopes such as $8$ of them as I did to well approximate the optimal curve from the previous single wall problem, perhaps I can get very close to optimal.
So far all I have are $3$ slopes with the $4$th slope being automatic as it will always go from mile marker $1.5$ directly to B since no wall will ever be there. Here is what I have so far:
Segment $1$: From $0.0$ to $0.5$ : slope $.49$
Segment $2$: From $0.5$ to $1.0$ : slope $.25$
Segment $3$: From $1.0$ to $1.5$ : slope $-.22$
Segment $4$: From $1.5$ to $2.0$ : slope $-.52$
Average walk distance is $2.7089$ miles. ($1,000,000$ random wall walks).
Perhaps next what I can do is pick some midslope between segment $1$ and $2$ for example and see if that improves things any. For example, keep $.49$ slope the first half mile but instead of a fixed slope of $.25$ the next half mile, perhaps try $.35$ and $.15$ each a $1/4$ mile. Those have the same average slope but better approximates a curve. When I did this I got a slight improvement to $2.7065$ (also $1,000,000$ random wall walks).
$UPDATE~~4$ - Here is the graph of the best walk path I have so far. The axis are y values on the left (miles above the centerline), and across the bottom are the x values in $1/4$ mile increments. Notice the near symmetry of the graph. I get about $2.704$ miles average walk length for this. The length of the rough curve itself is about $2.152$ miles.
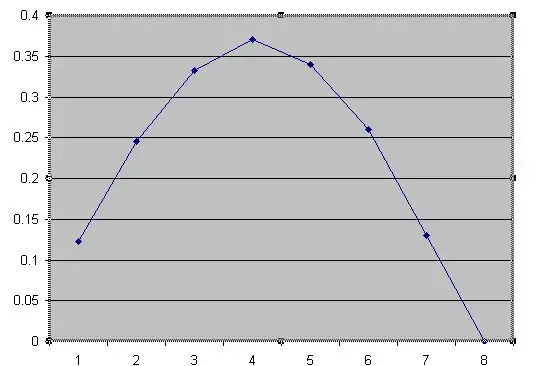
$UPDATE~~5$ - A function, y=f(x) which creates a symmetric curve and is fairly simple is y = $-0.0257143x^2 + 0.205714x - 0.05$. This is using units of $1/4$ mile for the x axis and not including the starting point A and stopping point B which we know are at y=$0$. For the x values we go from $1$ to $7$ which represents $1/4$ to $7/4$ of a mile from A along the x axis. The y points we hit are $.13, .26, .33, .37, .33, .26, .13$ and of course $0$ at A and B. This function generates a smoother curve of the approximated curve shown above.
Actually something "suspicious" is going on here. This answer seems too simple yet it works... Notice that on the graph, the middle mile (from x values $2$ to $6$ which represents mile markers $2/4$ to $6/4$) go roughly from y positions $.25$ at the corners to $.375$ in the middle. $.25$ is half the height of the small wall and $.375$ is half the average of the $2$ wall heights. If you just pick those y values and then connect them with a smooth curve, it should be near optimal! How is that for simple? Someone could have actually guessed this solution and be very close to optimal with virtually no math! (they just have to know how to take the average of $2$ numbers) and connect dots. I think probably a $7$ year old can do that.
A super simple approximation to this curve would be $0.5$ slope the first half mile, then $0.25$ slope the next half mile, then a mirror image on the other side of mile marker $1$ (symmetrically going back down to B). It seems ironic that a near optimal solution to a very complex problem appears to be super simple (once I did some simulation and got the general shape of the curve). I wonder if this is a coincidence or if it is somehow related to the height of the $2$ walls. I suppose I could change the height of the $2$ walls in my simulation program and see what I get if the relationship holds. It may also be related to the probabilities of each wall.


