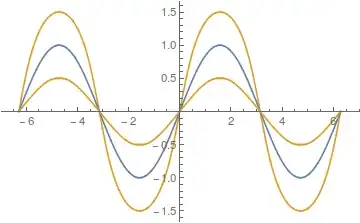
Suppose I have a curve – say a sine curve
y=sin(x)
Now I want to draw a second curve, y = ½sin(x), but relative to the first – so it has the first one as a “baseline”. I don’t mean just adding the values (even I can do that!) but as though space itself is curved relative to the first curve...
How impossible is it to come up with a formula to plot this..... ?
[edit] I suppose, what I mean is that at a point x along sin(x) - i.e. distance x measured along the curve, not the x-axis - draw the normal to the curve, and plot the point on that at distance ½sin(x).