Using BCE for an output with range $[0,1]$ is not incorrect.
As you know the loss with binary cross entropy is calculated as:
$$
-{(y\log(p) + (1 - y)\log(1 - p))}
$$
If $y=1$, the first part of the formula will be activated, and if $y=0$ the second part will be activated. However, imagine if we do not have exactly $y$ as $0$ or $1$, but any number between them. Still, the formula works and returns the loss of predictions against true labels. In this case, the difference is that it is not limited to activating either $-y\log(p)$ or $-(1 - y)\log(1 - p)$. Both of them will be partially activated.
P.S: Of course, you can also use mean_squared_error as a loss function for autoencoders.
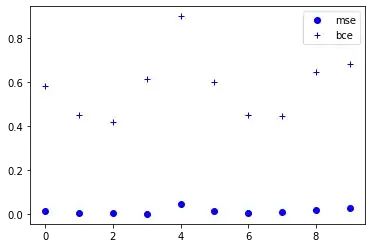
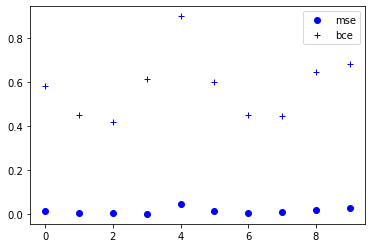
UPDATE: I think there is no advantage to using which one. It's up to your objective and in some cases may one of them suit more your needs. Just one thing that may be important is that BCE returns a higher loss than MSE and in cases in which you want to penalize errors more, BCE is preferred. I will compare the result of both of them for losses against random data.
# binary cross-entropy
def bce(y_t,y_p):
  epsilon = 1e-4
  return -(y_t*np.log(y_p+epsilon)+(1-y_t)*(np.log(1-y_p+epsilon)))
mean squared error
def mse(y_t,y_p):
  return (y_p-y_t)**2
random labels and logits
y_t_array = tf.random.uniform((1,10),minval=0,maxval=1).numpy()
y_p_array = tf.random.uniform((1,10),minval=0,maxval=1).numpy()
loss for each pair of the above arrays
loss_mse_array = [mse(i,j) for i,j in zip(y_t_array,y_p_array)]
loss_bce_array = [bce(i,j) for i,j in zip(y_t_array,y_p_array)]
plot the losses for a better comparison
import matplotlib.pyplot as plt
plt.plot(range(len(loss_mse_array[0])) , loss_mse_array[0], 'bo')
plt.plot(range(len(loss_bce_array[0])) , loss_bce_array[0], 'b+')
plt.legend(["mse","bce"], loc="upper right")
plt.show()