Currently reading Learning from Little: Comparison of Classifiers Given Little Training
In 3 Experiment Results, the following graph is shared:
The experiment is described as follow
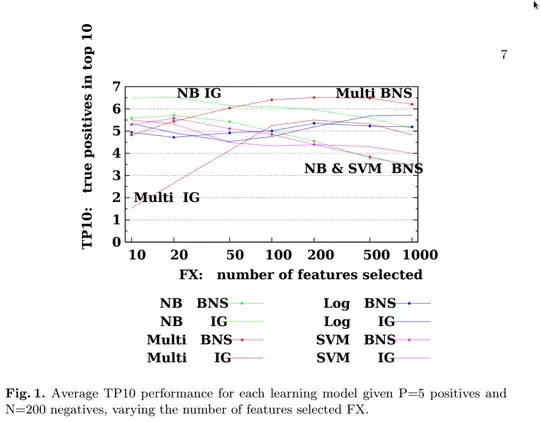
We begin by examining an example set of results for the average TP10 performance over all benchmark tasks, where the training set has P=5 positives and N=200 negatives.We vary the number of features selected along the logarithmic x-axis.
I understand this as "we use a training set of 205 elements, 5 being positives and the 200 remaining being negatives". But looking at the results, Naive Bayes using Information Gain with a few features, and Multinomial Naive Bayes using Bi-normal separation with several hundred features both end up with 6.5 true positives in the top 10 (The TP10 metric is the number of true positives found in the 10 test cases that are predicted most strongly by the classifier to be positive).
I would have assumed that the models being closest to 5/10 would be the most accurate, but reading their results, it looks like the higher the better. Thus, it feels like I overlooked and misunderstood something. Can somebody enlighten me on this issue ?
Thank you