Edited after comments in other answers:
Generally speaking, I would reframe this as a linear sum assignment problem.
This can be solved using a modified version of Munkres algorithm allowing a cost for non-assignment. wich time complexity is pretty bad ($O(n^3)$), but will work for a dozen fishes. For, reference, the Matlab version allows you to handle tracks that end and start across frames, i.e fishes that disappear and appear between frames.
To use the Munkres algorithm, you need to define a cost matrix, with $N_{tracks}$ rows (first frame) and $N_{detections}$ columns (second frame).
The Munkres algorithm will minimize the global assignment cost.
Case 1: significant overlap of bounding boxes across frames (tracking problem):
For the track $i$ in the first frame and detection $j$ in the next one, you can define the cost as $IoU(i, j)$ which is the intersection over union of the two bounding boxes for track $i$ and detection $j$. You could also consider using the distance between the centroid of the bounding boxes $d(i, j)$ or a combination of the two with a total cost such as $C(i, j) = IoU(i, j) + \alpha \times d(i, j)$ with $\alpha$ a parameter to determine to tune the respective weight of each cost in the full cost matrix. If you are only using bounding boxes the IoU is pretty easy to compute.
Case 2: no significant overlap of bounding boxes across frames (detection problem):
In that case, you cannot rely on positional information. But hopefully, the fish shapes remain largely unchanged. So you can build descriptors/features, for instance:
- bounding box area: measure the number of pixels in the bounding box (this assumes the fish also didn't change orientation drastically, as fishes are pretty flat so the area from the side will be very different from the area from the front. You could consider using the longest side of the bounding box to mitigate this
- color composition: create a binned RGB histogram from all the pixels in the fish (ideally you would have access to a finer segmentation than just a bounding box to make it less sensitive to the background color)
You could also use feature descriptors such as SIFT, AKAZE, etc...
But it all comes down to the same two steps:
- find a good way to compare any pair of objects across frames
- make an optimal decision about how to match them across frames and how to decide which are missing
The second part will always be a linear sum assignment problem.
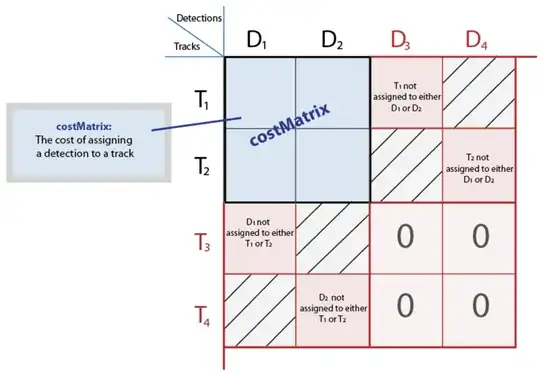
So the only thing now is that the scipy version doesn't offer the option to specify the unassignedTrackCost or unassignedDetectionCost like the Matlab version does. And this is actually what will allow you to handle fishes appearing or disappearing the way the Matlab version does. So you will need to modify it. Looking at the picture below, you now have the costMatrix and you need to build the bigger matrix to be able to handle the cases when fish appear or disappear.
Once you have managed to create the full cost matrix you can solve it using linear_sum_assignment and then find the tracks (resp. detections) that were assigned to dummy detections (resp. tracks).
Implementation
Getting the Cost matrix (distance only)
import pandas as pd
import numpy as np
import matplotlib.pyplot as plt
import seaborn as sns
from scipy.spatial.distance import cdist
from scipy.optimize import linear_sum_assignment
def transform(df):
    df["centroid_x"] = (df["xmax"] + df["xmin"]) / 2
    df["centroid_y"] = (df["ymax"] + df["ymin"]) / 2
    return df
df0 = pd.read_csv("first_frame.csv")
df1 = pd.read_csv("second_frame.csv")
df0 = transform(df0)
df1 =  transform(df1)
distance_cost_matrix = cdist(df0[["centroid_x", "centroid_y"]], df1[["centroid_x", "centroid_y"]])
cost_mat = np.log(distance_cost_matrix) #np.log(np.multiply(area_cost_matrix, distance_cost_matrix))
Modified Munkres algorithm
def pseudo_inf(cost_mat, inf_func):
    pseudo_inf_val = inf_func(cost_mat[cost_mat != np.inf])
    pseudo_cost_mat = cost_mat.copy()
    pseudo_cost_mat[pseudo_cost_mat == np.inf] = pseudo_inf_val
    return pseudo_cost_mat, pseudo_inf_val
def get_costs(cost_mat, row_ind, col_ind):
    costs = [cost_mat[i, j] for i, j in zip(row_ind, col_ind)]
    return costs
def assign_detections_to_tracks(
        cost_mat,
        cost_of_non_assignment=None
    ):
    # in case there are infinite value, replace them by some pseudo infinite
    # values
    inf_func =  lambda x: np.max(x) * 2
    pseudo_cost_mat, pseudo_inf_val = pseudo_inf(cost_mat, inf_func)
    assigned_rows = []
    unassigned_rows = []
    assigned_cols = []
    unassigned_cols = []
    full_cost_mat = None
    # basic case, handled by linear_sum_assignment directly
    if cost_of_non_assignment is None:
        assigned_rows, assigned_cols = linear_sum_assignment(pseudo_cost_mat)
        assignment_costs = get_costs(cost_mat, assigned_rows, assigned_cols)
    # if one cost of non assignment is provided, use it
    else:
        # build the pseudo-array
        top_right_corner = np.full((cost_mat.shape[0], cost_mat.shape[0]), pseudo_inf_val)
        np.fill_diagonal(top_right_corner, cost_of_non_assignment)
        bottom_left_corner = np.full((cost_mat.shape[1], cost_mat.shape[1]), pseudo_inf_val)
        np.fill_diagonal(bottom_left_corner, cost_of_non_assignment)
        top = np.concatenate((cost_mat, top_right_corner), axis=1)
        zero_corner = np.full(cost_mat.T.shape, 0)
        # zero_corner = np.full(cost.shape,cost_of_non_assignment)
        bottom = np.concatenate((bottom_left_corner, zero_corner), axis=1)
        full_cost_mat = np.concatenate((top, bottom), axis=0)
        # apply linear assignment to pseudo array
        row_idxs, col_idxs = linear_sum_assignment(full_cost_mat)
        # get costs
        for row_idx, col_idx in zip(row_idxs, col_idxs):
            if row_idx < cost_mat.shape[0] and col_idx < cost_mat.shape[1]:
                assigned_rows.append(row_idx)
                assigned_cols.append(col_idx)
            elif row_idx < cost_mat.shape[0] and col_idx >= cost_mat.shape[1]:
                unassigned_rows.append(row_idx)
            elif col_idx < cost_mat.shape[1] and row_idx >= cost_mat.shape[0]:
                unassigned_cols.append(col_idx)
        #
        full_costs = get_costs(full_cost_mat, row_idxs, col_idxs)
        assignment_costs = get_costs(
            full_cost_mat, assigned_rows, assigned_cols)
    return assigned_rows, assigned_cols, unassigned_rows, unassigned_cols, full_cost_mat, assignment_costs
Peforming the assignment:
cost_of_non_assignment was tuned looking at a histogram of cost_mat.ravel()
(
    assigned_rows,
    assigned_cols,
    unassigned_rows,
    unassigned_cols,
    full_costs,
    assignment_cost
) = assign_detections_to_tracks(cost_mat, cost_of_non_assignment=10)
unassigned_rows, unassigned_cols
Results
df0.iloc[unassigned_rows, :]
          name  xmin  ymin  xmax  ymax centroid_x centroid_y
0     big fish  1080   484  1236   597   1158.0     540.5
1   small fish   684   505   732   535    708.0     520.0
2   small fish   743   598   792   642    767.5     620.0
it works!


