0

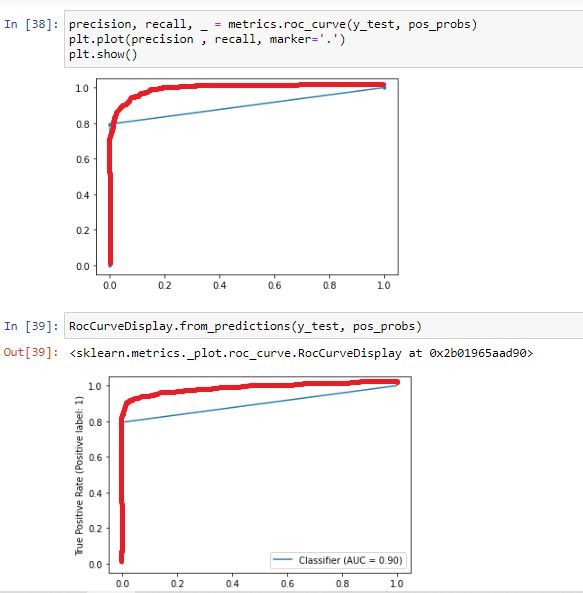
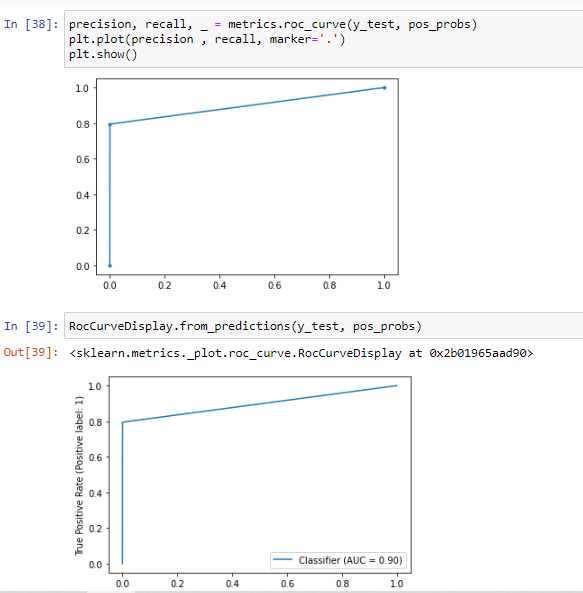
I dislike the square look of this AUC curve (SKLearn).

The purpose of this question is "visual". Please post code snippets.

This question is not requesting the theory behind the AUC.

My goal is to make the curve look like a curve. Right now, the curve looks like a square.

Please refer to the sample code below.

precision, recall, _ = metrics.roc_curve(y_test, pos_probs)
plt.plot(precision , recall, marker='.')
plt.show()
RocCurveDisplay.from_predictions(y_test, pos_probs)

The code above produces the below ugly curves.

enter image description here

The curve appearance I want to achieve (red line only).

enter image description here

Full Array
  • 224
  • 1
  • 7

1 Answers1

1

As Dave and Thiago are saying in the comments, the shape of the ROC curve depends on the data, especially the number of possible thresholds in the data.

(it's not called AUC curve btw, AUC stands for "Area Under Curve")

Here you can find an explanation about how the ROC curve is defined, which explains why it has a particular shape.

Your curve looks as if there are only 3 points, including the two extremes. You're right that this is not typical.

  • Imho the most likely is an error: check the values in pos_probs, because apparently they have only a few distinct values. Are these values obtained with predict or predict_proba? It should be the latter (common mistake, see here for instance).
  • Otherwise it's a matter of too few different points in the data: how many instances do you have? Are the instances diverse enough? If you only have a couple distinct instances, then this kind of curve would be normal. If so, making the curve artificially similar to the red line would be a mistake.
Erwan
  • 26,519
  • 3
  • 16
  • 39