TensorNetwork.org or tensors.net are great places to see introductory examples, and the math3ma blog has a wonderful little intuitive introduction, while Hand-waving and interpretive dance: an introductory course on tensor networks is a nice reference to understand this notation more systematically. Additionally, I have written my own introduction to the notation, heavily inspired by the other references. It's aimed for a machine learning / interpretability context, but should be mostly understandable to everyone.
Here are some excerpts:
In graphical notation, tensors are represented as shapes with "legs" sticking out of them. A vector can be represented as a shape with one leg, a matrix can be represented as a shape with two legs, and so on:
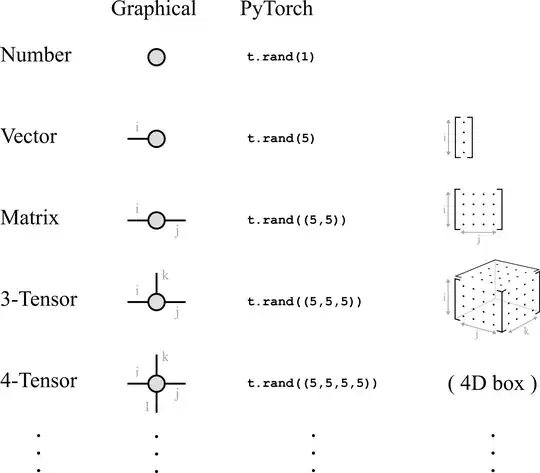
Each leg corresponds to an index of the tensor - specifying an integer value for each leg of the tensor addresses a number inside of it:

where 0.157 happens to be the number in the (i=0,j=2,k=0) position of the tensor A. In python, this would be A[0,2,0]. The amount of memory required to store a tensor grows exponentially with the number of legs, so tensors with lots of legs are usually represented only implicitly: decomposed as operations between many smaller tensors.
Connecting the legs of two tensors indicates a tensor contraction (also known as an Einstein summation). Here are the most common kinds of contractions between vectors and matrices:
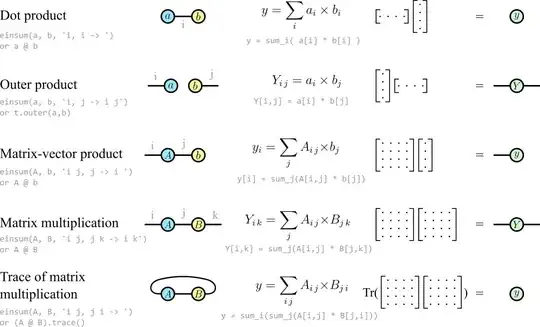
In every case you can tell how many legs the resulting tensor will have by the number of uncontracted "free'' legs on the left.
But graphical notation is most useful for representing unfamiliar operations between many tensors. One example in this direction is $\sum_{\alpha \beta} A_{i \alpha \beta}v_{\beta}B_{\alpha \beta j}=M_{ij}$, which can be represented in graphical notation as

The middle part of the graphical notation here shows that the number in each i, j position of the final matrix can be calculated with a sum over every possible indexing of the internal legs α and β, where each term in the sum consists of three numbers being multiplied (though in practice the contraction should be calculated in a much more efficient way).
Graphical notation really comes into its own when dealing with larger networks of tensors. For example, consider the contraction
$\sum_{i\,j\,k\,l\,m\,n\,o\,p\,q\,r\,s\,t\,u} A_{ij} V_{ir} B_{jkl} W_{rks} C_{lmn} X_{smt} D_{nop} Y_{tou} E_{pq} Z_{uq},$
which is tedious to parse: indices must be matched up across tensors, and it is not immediately clear what kind of tensor (eg. number, vector, matrix ...) the result will be. But in graphical notation this is
 and we can immediately see which tensors are to be contracted, and that the result will be a single number. Contractions like this can be performed in any order. Some contraction orders are much more efficient than others, but they all get the same answer eventually.

