7

I came across some derivatives w.r.t functions such as, $\frac{d(7^x)}{d(x^7)}$,

I tried plotting their graphs and seeing how we can relate the change in the value of $7^x$ as the function $x^7$ is changing. Can someone please provide visualization for this specific example or just a general intuitive explanation?

Thank you!

heerboi
  • 81

1 Answers1

5

In general, $\dfrac{df(g(x))}{dg(x)}$ means $\dfrac{df(u)}{du}\Biggr|_{\large{u=g(x)}}=f'(g(x)) \, .$ You want to consider the behaviour of the function $f$ when $g(x)$ is incremented by an infinitely small amount $dg(x)$ (notice that the fact that $g$ itself is a function is irrelevant here—you simply want to treat $g(x)$ as a variable like any other). So informally, we have $$ \frac{df(g(x))}{dg(x)}=\frac{f(g(x)+dg(x))-f(g(x))}{dg(x)} \, . $$ Nowadays, we tend to think in terms of limits instead of "infinitesimals", and so we would write $$ \dfrac{df(g(x))}{dg(x)}=\lim_{h \to 0}\frac{f\left(g(x)+h\right)-f(g(x))}{h} \, . $$ In your example, $$ \frac{d(7^x)}{d(x^7)}=\frac{d\left(7^{\sqrt[7]{x^7}}\right)}{d(x^7)}=\frac{d\left(7^{\sqrt[7]{u}}\right)}{du}\Biggr|_{\large{u=x^7}}=\lim_{h \to 0}\frac{7^{\sqrt[7]{u+h}}-7^{\sqrt[7]{u}}}{h}\Biggr|_{\large{u=x^7}}=\lim_{h \to 0}\frac{7^{\sqrt[7]{x^7+h}}-7^{\sqrt[7]{x^7}}}{h} \, . $$ 
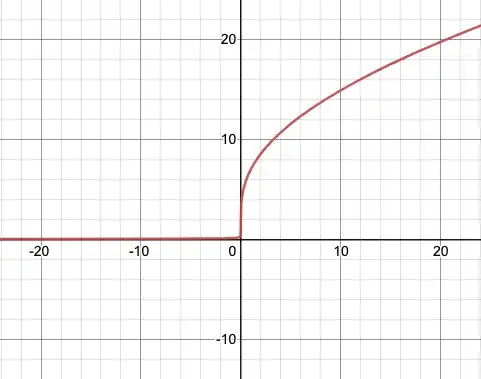
This tells us that the quantities $x^7$ and $7^x$ are related by the function $u\mapsto 7^{\sqrt[7]{u}}$. Here is a plot of $7^{\sqrt[7]{u}}$ against $u$:

Plot

Using the chain rule multiple times tells us that \begin{align} \frac{d\left(7^{\sqrt[7]{u}}\right)}{du}\Biggr|_{\large{u=x^7}} &= \frac{1}{7} \cdot \log 7 \cdot 7^{\sqrt[7]{u}} \cdot u^{-6/7} \\[5pt] &= \frac{7^x \cdot \log 7}{7x^6} \, . \end{align} Note that this result agrees with writing $$ \frac{d(7^x)}{d(x^7)} = \frac{d(7^x)}{dx} \cdot \frac{dx}{d(x^7)} \, , $$ and using the inverse function theorem, which is probably the quickest way to arrive at the answer.

Joe
  • 22,603
  • So, when visualizing the two graphs individually, is this graph how they're related for not necessarily infinitely small values but almost small values? – heerboi Jun 22 '21 at 07:28
  • 1
    @heerboi: I don't fully understand your question, but the problem with that plot is that the slope of the red curve is $\frac{df(x)}{dx}$, and the slope of the blue curve is $\frac{dg(x)}{dx}$. You need to find $\frac{df(g(x))}{dg(x)}$, and to do this you should consider how $7^x$ is related to $x^7$, not $x$. So to visualise this, you want to put $x^7$ on the horizontal axis. We don't care about what happens when $x$ is incremented by an "infinitely small" amount, but rather what happens when $x^7$ is incremented by an "infinitely small" amount. – Joe Jun 22 '21 at 08:10
  • 1
    To be more precise, $$\frac{d(7^x)}{d(x^7)}=\frac{d\left(7^{\sqrt[7]{x^7}}\right)}{d(x^7)}=\lim_{h \to 0}\frac{7^{\sqrt[7]{x^7+h}}-7^{\sqrt[7]{x^7}}}{h} , .$$Does that help? – Joe Jun 22 '21 at 08:11
  • It's all good! Yes, that explanation helped. So as I understood it, we transform $x^7$ to somehow be the horizontal axis by $u=x^7$ , and then find how $7^x$ is related to $u$? – heerboi Jun 22 '21 at 08:13
  • 1
    @heerboi: Yes, exactly. You want to find how $7^x$ is related to $u$. So if $u$ is incremented by a small amount, then what happens to $7^x$? That's what $\frac{df(g(x))}{dg(x)}$ means. – Joe Jun 22 '21 at 08:13
  • 1
    @heerboi: If you give me a few minutes, I can think of a way of visualising this based on the plot that you gave a link to... – Joe Jun 22 '21 at 08:16
  • Although it isn't mandatory, it would be a great help! I'm not in a hurry so take your time with it. :D – heerboi Jun 22 '21 at 08:40