29

I am looking for (preferably free) software to:

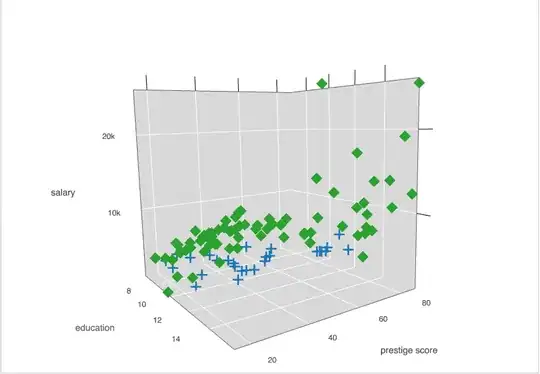
1) plot 3d points read from a file. A scatter plot would be fine.
2) Optionally color the points by a property - also read from the file

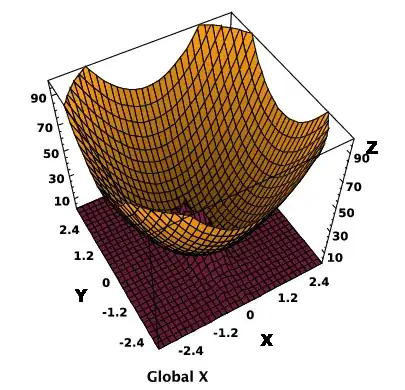
It would be terrific if this program could also compute and display the best fit plane through these points.

Andrew S.
  • 473
  • Note: if your a student, Andrew, there are some significant discounts available, e.g. on Matlab, Mathematica, not to mention word processing software. Sage.org (free-source) has Sage available on-line for use and storage of work (remember Sage contains R, GAP, 3-4 additional programs), and it can be downloaded, but I had to do so through VMWare (virtual machine)... – amWhy May 23 '11 at 04:23
  • Thank for the suggestion - regretfully not a student :( – Andrew S. May 24 '11 at 22:09

9 Answers9

19

There are quite a number of freewares which do that.

  1. Gnuplot, with a very interesting not so frequently asked questions here (archive version), fit is easily obtained. Nice outputs to PDF and LaTeX
  2. Matplotlib: requires Python, so that's probably not your best option if you need to produce graphs quickly, but if you are thinking about a long term solution, I would go for this one,
  3. R, normally for statistical computations, but quite nice plotting possibilities. Also, it is a software which is intended to read data in files, so it has very powerful and easy to use functions to import CSV files and the likes,
  4. Octave not a big fan. Don't know the new major release, though. Previous releases were based on Gnuplot for the graphic part,
  5. Scilab has continuously grown througout the years, so as to become a monster now. Not a big fan either.

Hope you'll find your best choice here !!! Good luck, Sébastien

Sebastien
  • 619
  • Any preferences? I've got sage, with GAP, R, ..., Matlab, Mathematica, some graphics programs not readily beneficial, save for geometer's sketchpad (which can be posted to web), but I have to go through 2 saves to different formats for an image file...Would certainly appreciate "reading in capabilities", but my work is more abstract, at this point...lots of tools at my disposal, but there's also the time-factor involved in "getting up to speed" in using the software so it can be used productively...So many choices...hard to know what to focus on learning first – amWhy May 23 '11 at 04:18
  • Option 1 is my favourite, but I'm partial, since I've been using it for almost ten years now. I like gnuplot, because you have the opportunity to script your plots. That's particularly useful if you change your calcs and need to update the corresponding graph(s) accordingly. Mind you, this is true of all the other options (!), but the syntax of GNUPLOT is particularly simple. Not sure I'm very helpful, here. Note that coloring points according to property read in file might be more of an issue. You can do it programmatically (options 2-5), but it would be more difficult with GNUPLOT. – Sebastien May 23 '11 at 04:52
  • Thanks, Sebastien. I've already checked out your link to Gnuplot. I'll look into it a bit more! – amWhy May 23 '11 at 05:39
  • This is a very useful list - I think i will start with GNUPlot Thank you :) – Andrew S. May 24 '11 at 22:10
  • The link for not so frequently asked questions is broken :(. The new link is here – Ciprian Tomoiagă Mar 01 '16 at 20:13
7

I checked all of the above options out and if you want to plot something in 3D in the next ten minutes, and not ten days from now, check out Graphing Calculator 3D.

4

Asymptote vector graphics language. Check out the gallery of graphs/plots/sketches. Here is very pretty examples/code page from France.

Iso plot Surface plot

John Alexiou
  • 14,616
3

Another one is Plotly, which is entirely web-based and free for public use.

3d scatter plot

Disclaimer: I help develop Plotly

3

DataMelt math program for numeric and statistics computations looks good for plotting functions, data and histograms in 3D, and saving outputs in vector-graphics formats. It is free and written in Java (so, runs on any computer). It is also portable, so no problem with installation.

Here is one example of function and a histogram: enter image description here

marry
  • 31
1

I personally prefer to use GeoGebra, it has simple plotting functions and nice 3D graphing as well. To input a point, all you need is the ordered triple and it will plot it for you. It can also graph spheres and the like.

Hope this helps.

  • Can you edit the answer, including a link to the official website of Geogebra and maybe a picture? That would be awesome. –  Aug 26 '16 at 13:24
  • It has a built in spreadsheet where you can copy and compute your data. Creating a scatterplot is as easy as: select the three columns, right click, choose "create list of points". However, I personally do not like it for a scatterplot. The default representation of points is big solid balls each with a label. First, you need to go to the settings and toggle the option "Labeling: No new object". Then somehow shrink the point-balls to point-points. This extra work is always frustrating IMHO – Luca Ghidelli Mar 22 '22 at 09:04
1

I'm coming late on this thread, but geogebra: https://www.geogebra.org/ is a great simple tool. It can run in a web browser and it's very easy to use.

jeremie
  • 111
1

There is also MayaVi2:

http://mayavi.sourceforge.net/

But I am not sure how it compares with other visualization libraries... would like to hear more comments on it.

Yan King Yin
  • 1,239
  • the way the OP describes his needs, mayavi would be overkill. But it's IMHO the prettiest of the 3d plotters I've tried. Highly recommended. – PatrickT May 15 '17 at 09:33
0

Look at maxima draw vtk .

One criteria that I apply to 3d graphs , is that they have proper perspective. By this I mean that lines and objects appear smaller the further away from the viewer they are.

Also hidden line and surface. Three dimensional rotation ; scaling.

Real time updating.

Finally , maybe ray tracing.