I am trying to simulate a Brownian Bridge starting at $0$ and finishing at $\alpha$ at some time $T$ in an Excel spreadsheet. However I am not sure the behaviour I am getting is to be expected, namely the simulated Brownian Bridge's trajectory becomes approximately linear after a certain point.
I base my Brownian Bridge on the representation found in this question: $$B_t = \alpha \frac{t}{T}+\left(1-\frac{t}{T}\right)\int_{0}^T \dfrac{dW_s}{1-\frac{s}{T}}$$ My simulation scheme is as follows, with $n$ the total number of simulation steps and $\delta=1/n$, where $i$ represents a simulation step: $$\begin{align} & N_i \leftarrow Z \sim \mathcal{N}(0,1) \\ & w_i \leftarrow \delta^{1/2}N_i \\ & B_i \leftarrow \alpha i\delta+(1-i\delta)\sum_{j\leq i}(1-j\delta)^{-1}w_j \end{align}$$ I display below one such simulation of the Brownian Motion $W$ and the Brownian Bridge $B$ (anchored at $0$ both at beginning and end):
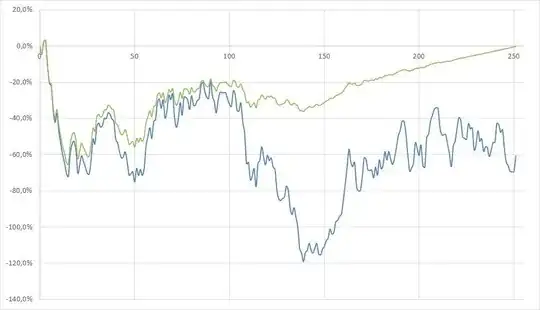
Clearly the Bridge behaves less and less like a random quantity as we approach the terminal time. This does not seem right to me. Is there something wrong with my simulation procedure? What is going on here?