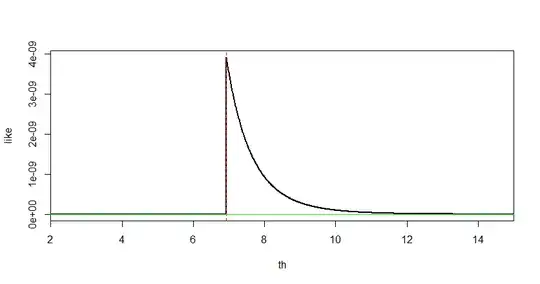
The MLE is the maximum $W$ of the sample $X_i, X_2,
\dots, X_n,$ as illustrated in the figure below.
This MLE cannot be found by differentiation because
the likelihood function is discontinuous at its maximum.
The true parameter value is $\theta = 7.$ The likelihood function for a particular sample of size $n=10$ is shown in the interval $(2, 15).$ The largest value in the sample is $W = 6.926851.$
You should formulate a mathematical argument that describes what you see in the figure.
th = seq(2,15, by=.01); n=10;  m=length(th)
like = numeric(m)

x = runif(n, 0, 7); sort(round(x, 4))
[1] 0.4111 2.6044 3.2130 4.1652 4.5213
[6] 4.7329 6.0148 6.0578 6.6110 6.9269
w = max(x);  w
[1] 6.926851

for(i in 1:m) {
  like[i] = prod(dunif(x, 0, th[i])) }
plot(th, like, type="l", lwd=2, xaxs="i")
  abline(v=w, col="red", lty="dashed")
  abline(h=0, col="green2")
Note: Obviously, the MLE is biased. The maximum $W$ of the data can never exceed $\theta.$ But
$E\left(\frac{n+1}{n}W\right) = \theta.$
