You could also write a GAP script to output the matrix to R. For example:
MatrixToR:=function(M)
  local nrow,ncol;
  nrow:=Size(M);
  ncol:=Size(M[1]);
  Print("A = matrix(c(");
  for i in [1..nrow] do
    for j in [1..ncol] do
      if(i=nrow and j=ncol) then Print(M[i][j]); continue; fi;
      Print(M[i][j],", ");
    od;
  od;
  Print("),nrow=",nrow,",ncol=",ncol,",byrow=TRUE)\n");
end;;
So, if we run this
MatrixToR(MultiplicationTable(Random(AllSmallGroups(12))));
it produces:
A = matrix(c(1, 2, 3, 4, 5, 6, 7, 8, 9, 10, 11, 12, 2, 1, 5, 6, 3, 4, 9, 10, 7, 8, 12, 11, 3, 5, 1, 7, 2, 9, 4, 11, 6, 12, 8, 10, 4, 6, 7, 8, 9, 10, 11, 1, 12, 2, 3, 5, 5, 3, 2, 9, 1, 7, 6, 12, 4, 11, 10, 8, 6, 4, 9, 10, 7, 8, 12, 2, 11, 1, 5, 3, 7, 9, 4, 11, 6, 12, 8, 3, 10, 5, 1, 2, 8, 10, 11, 1, 12, 2, 3, 4, 5, 6, 7, 9, 9, 7, 6, 12, 4, 11, 10, 5, 8, 3, 2, 1, 10, 8, 12, 2, 11, 1, 5, 6, 3, 4, 9, 7, 11, 12, 8, 3, 10, 5, 1, 7, 2, 9, 4, 6, 12, 11, 10, 5, 8, 3, 2, 9, 1, 7, 6, 4),nrow=12,ncol=12,byrow=TRUE)
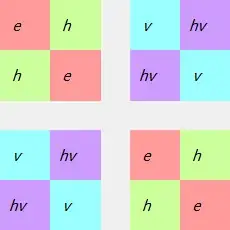
which can be input into R an plotted in colour using the plotrix function color2D.matplot, as follows
require(plotrix)
color2D.matplot(A)
which will plot
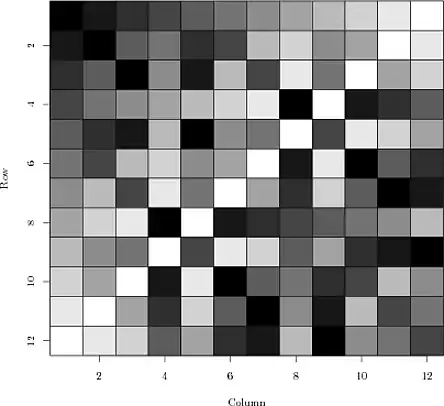
(You may need to run install.packages("plotrix") to install the R package.)

 .
.


