I'm trying to understand and experiment with how the SHAP value can explain behaviour for each outlier events (rows) and how it can be related to shap.force_plot(). I already created a simple synthetic dataset with 7 outliers.
- I didn't get how 4.85 calculated as output model.
outliers_df = temp_dataset.loc[synth_data_df[outdet.label_feature] == 1]
outliers_df
#Here is the frame of 7 outlier cases I input to SHAP:
+----+-------------+--------------+---------------+
| id |      NF1    |      CF1     |outlier_scores |
+----+-------------+--------------+---------------+
|  1 |       904   |     2        | -0.192221     |
|  2 |       951   |     3        | -0.203116     |
|  3 |       125   |     5        | -0.076722     |
|  4 |       755   |     2        | -0.237189     |
|  5 |       983   |     2        | -0.213205     |
|  6 |       906   |     3        | -0.202074     |
|  7 |       999   |     5        | -0.266428     |
+----+-------------+--------------+---------------+
I applied IsolationForest using class OutlierDetector in my implementation to isolate outliers:
outdet = OutlierDetector(synth_data_df, label_feature="label",
                         normalize_outlier_scores=True, standardize_outlier_scores=False,
                         n_estimators=100, max_samples=1., contamination=0.1)
outdet.train_IF()
I got SHAP for each rows:
outdet.shap_values_outliers = outdet.explainer.shap_values(outliers_df)
outdet.shap_values_outliers
array([[-6.0205, -0.7785,  0.    ],
       [-6.3379, -0.7031,  0.    ],
       [-2.9014, -1.0911,  0.    ],
       [-6.6259, -1.1502,  0.    ],
       [-6.445 , -0.8171,  0.    ],
       [-6.2393, -0.7787,  0.    ],
       [-8.1958, -0.1862,  0.    ]])
This is simple shap.force_plot() for first row for 3 features. I already concatenate outlier_scores to the frame after I trained my model with NF1 and CF1 as follow:
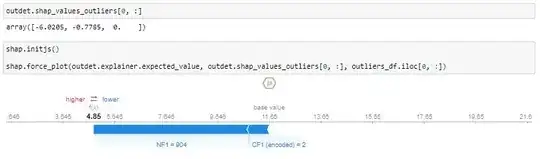
How to get $\text{basic}_\text{value} = 11.65$ via a script, as explained here?
General interpretation considering $\text{basic}_\text{value} = 11.65$ and $\text{Model}_\text{output} = 4.85$ for first event or observation considering no features pushing the prediction higher are shownred by red color?
Reason for getting $\text{SHAP}_\text{outlier_scores} = 0$ ?
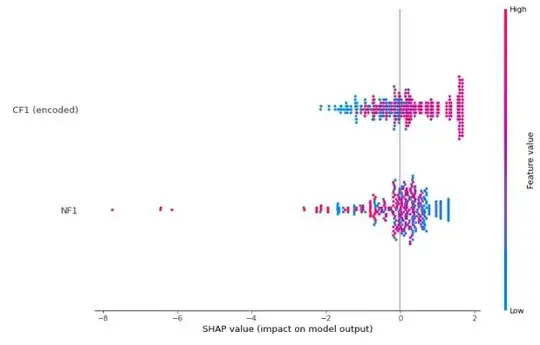
Edit I would also like to share the following plot, which may help to see if we can understand the contribution of one of these two features to explain outliers like $\text{SHAP}_\text{NF1} = [-8, -6]$:
outdet.plot_shap_values()