When people make 2D scatter plots what do they actually plot?
First case: when we want to get an embedding for specific inputs:
We either
Feed a hand-written character "9" to VAE, receive a 20 dimensional "mean" vector, then embed it into 2D dimension using t-SNE, and finally plot it with label "9" or the actual image next to the point, or
We use 2D mean vectors and plot directly without using t-SNE.
Note that "variance" vector is not used for embedding. However, its size can be used to show the degree of uncertainty. For example a clear "9" would have less variance than a hastily written "9" which is close to "0".
Second case: when we want to plot a random sample of z space:
We select random values of z, which effectively bypasses sampling from mean and variance vectors,
sample = Variable(torch.randn(64, ZDIMS))
Then, we feed those z's to decoder, and receive images,
sample = model.decode(sample).cpu()
Finally, we embed z's into 2D dimension using t-SNE, or use 2D dimension for z and plot directly.
Here is an illustration for the second case (drawn by the one and only paint):
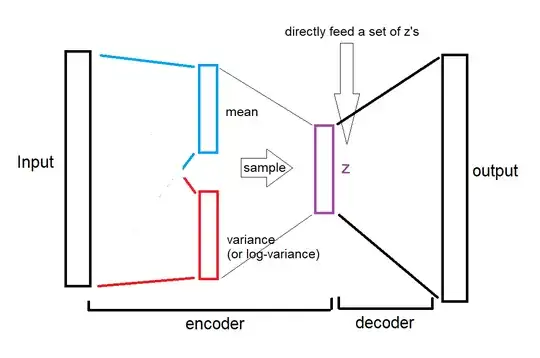
As you see, the mean and variances are completely bypassed, we directly give the random z's to decoder.
The referenced article says the same thing, but less obvious:
Below you see 64 random samples of a two-dimensional latent space of MNIST digits that I made with the example below, with ZDIMS=2
and
VAE has learned a 20-dimensional normal distribution for any input digit
ZDIMS = 20
...
self.fc21 = nn.Linear(400, ZDIMS)  # mu layer
self.fc22 = nn.Linear(400, ZDIMS)  # logvariance layer
which means it only refers to the z vector, bypassing mean and variance vectors.
