Unsupervised k-NN
Unlike k-means, the unsupervised k-nn does not associate a label to instances. All it can do is tell you what instances in your training data is k-nearest to the point you are polling for.
For example:
import numpy as np
from sklearn.neighbors import NearestNeighbors
samples = [[0, 0, 2], [1, 0, 0], [0, 0, 1]]

neigh = NearestNeighbors(2, 0.4)
neigh.fit(samples)

neigh.kneighbors([[0, 0, 1.3]], 2, return_distance=False)
array([[2, 0]]...)
You can see that this returned the index of the k-nearest points, and not the label.
k-means
This algorithm is completely different. The k here denotes the number of assumed classes that exist in your dataset. For example if you have unlabeled pictures of red and green apples, you know that $k=2$. The algorithm will then move the centroids (the average of the cluster distributions) to a stable solution.
Here is an example:
Let's first make some artificial Gaussian distributed data.
import numpy as np
import matplotlib.pyplot as plt

params = [[[ 0,1],  [ 0,1]],
          [[ 5,1],  [ 5,1]],
          [[-2,5],  [ 2,5]],
          [[ 2,1],  [ 2,1]],
          [[-5,1],  [-5,1]]]

n = 300
dims = len(params[0])

data = []
y = []
for ix, i in enumerate(params):
    inst = np.random.randn(n, dims)
    for dim in range(dims):
        inst[:,dim] = params[ix][dim][0]+params[ix][dim][1]*inst[:,dim]
        label = ix + np.zeros(n)

    if len(data) == 0: data = inst
    else: data = np.append( data, inst, axis= 0)
    if len(y) == 0: y = label
    else: y = np.append(y, label)

num_clusters = len(params)

print(y.shape)
print(data.shape)
(1500,)
(1500, 2)
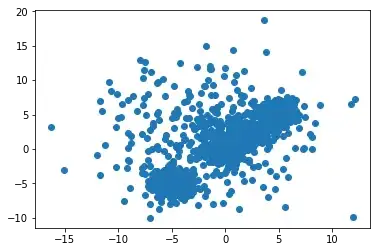
plt.scatter(data[:,0], data[:,1])
plt.show()
The k-means algorithm from scratch
class Kmeans(object):

    def __init__(self, k=1):
        self.k = k

    def train(self, data, verbose=1):

        shape = data.shape

        ranges = np.zeros((shape[1], 2))
        centroids = np.zeros((shape[1], 2))

        for dim in range(shape[1]):
            ranges[dim, 0] = np.min(data[:,dim])
            ranges[dim, 1] = np.max(data[:,dim])

        if verbose == 1:
            print('Ranges: ')
            print(ranges)

        centroids = np.zeros((self.k, shape[1]))
        for i in range(self.k):
            for dim in range(shape[1]):
                centroids[i, dim] = np.random.uniform(ranges[dim, 0], ranges[dim, 1], 1)

        if verbose == 1:
            print('Centroids: ')
            print(centroids)

            plt.scatter(data[:,0], data[:,1])
            plt.scatter(centroids[:,0], centroids[:,1], c = 'r')
            plt.show()

        count = 0
        while count < 100:
            count += 1
            if verbose == 1:
                print('-----------------------------------------------')
                print('Iteration: ', count)

            distances = np.zeros((shape[0],self.k))
            for ix, i in enumerate(data):
                for ic, c in enumerate(centroids):
                    distances[ix, ic] = np.sqrt(np.sum((i-c)**2))

            labels = np.argmin(distances, axis = 1)

            new_centroids = np.zeros((self.k, shape[1]))
            for centroid in range(self.k):
                temp = data[labels == centroid]
                if len(temp) == 0:
                    return 0
                for dim in range(shape[1]):
                    new_centroids[centroid, dim] = np.mean(temp[:,dim])

            if verbose == 1:
                plt.scatter(data[:,0], data[:,1], c = labels)
                plt.scatter(new_centroids[:,0], new_centroids[:,1], c = 'r')
                plt.show()

            if np.linalg.norm(new_centroids - centroids) < np.finfo(float).eps:
                print("DONE!")
                break

            centroids = new_centroids
        self.centroids = centroids
        self.labels = labels
        if verbose == 1:
            print(labels)
            print(centroids)
        return 1

    def getAverageDistance(self, data):

        dists = np.zeros((len(self.centroids),))
        for ix, centroid in enumerate(self.centroids):
            temp = data[self.labels == ix]
            dist = 0
            for i in temp:
                dist += np.linalg.norm(i - centroid)
            dists[ix] = dist/len(temp)
        return dists

    def getLabels(self):
        return self.labels
And the results
kmeans = Kmeans(5)
kmeans.train(data)
Ranges:
[[-15.42553872 14.88894099]
[-13.33192554 16.15415347]]
Centroids:
[[-11.39200726 -10.71208054]
[ 3.73634888 -8.9230959 ]
[ 6.17589734 -10.66376228]
[ 0.78973744 -0.44245535]
[
9.29524253 9.59127574]]
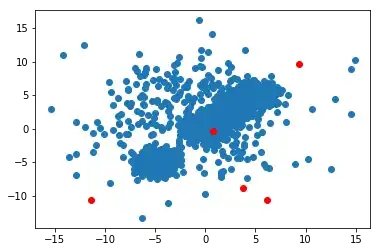
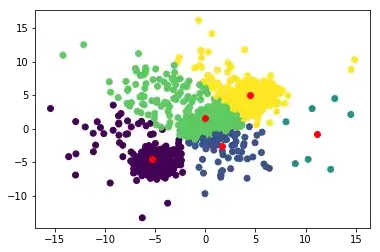
Initialize, the red points are the random centroids
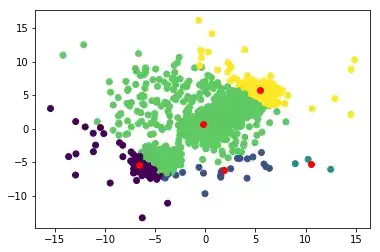
Iteration 1
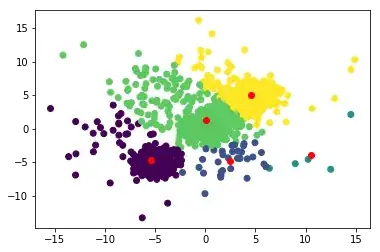
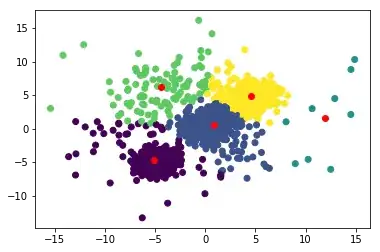
and after a few iterations