9

I'm analyzing how outliers in my dataset of size 8x8000 affect regression models. I have three scenarios: raw dataset (with outliers), Winsorized dataset (2% of the extreme outliers adjusted), and dataset without outliers (rows with outliers removed). I trained both linear regression and SVM models. R² steadily drops as outliers are reduced:

  • Raw dataset: R² = 0.98,
  • Winsorized dataset: R² = 0.94,
  • No outliers: R² = 0.89.

From my experience, removing outliers improves model performance, but this time it's the opposite. Could this be due to overfitting to the outliers in the raw data? Are there any other metrics I should be analyzing to better understand this behavior? Does it have to do with the way I transformed the data (Log + StandardScaler)? Are there IEEE or other academic papers that discuss outliers' effects on regression and machine learning models?

ml.freak
  • 103
  • 4

3 Answers3

20

I am going to provide an example why intuitively seeing a reduction in $R^2$ after removing outliers shouldn't be that surprising.

Suppose you want to study the relation between the weight and height of dogs. So you gather a bunch of data points containing everything from small chihuahuas to big German shepherds. Weights range from 2-20 kg and heights range from 20-80 cm. For some reason you also have a single giraffe in your data, it weighs 800 kg and is 4 meters tall. That is your outlier.

Now if you plot your entire data set and perform a linear regression on it, you will find a strong correlation between weight and height. The line will pass trough the center of the cloud of actual dog data points and the single giraffe point. Deviations between data points and the regression line will be small and $R^2$ will be high.

After plotting the data you notice the giraffe outlier, remove it, replot and redo the linear regression. You zoomed in a lot in the plot, the range of data both on the weight and height scale is much smaller. The correlation between height and weight among dogs is not very big. The data is just a big cloud of points. Your $R^2$ is much smaller.

Michael Mior
  • 107
  • 4
quarague
  • 658
  • 3
  • 9
11

A typical way to calculate $R^2$ involves a ratio of residual to total variance.

$$ R^2 = 1-\dfrac{ \text{ Residual variance } }{ \text{ Total variance } } $$

If you remove an outlier, you may decrease the total variance an enormous amount without getting a large reduction in residual variance. In that case, removing the outlier will decrease the $R^2$.

Given the comment that MSE (related to residual variance) decreases while $R^2$ also decreases, I find this explanation to be very likely.

Let's look at a simulation.

library(MASS)
library(ggplot2)
set.seed(2024)

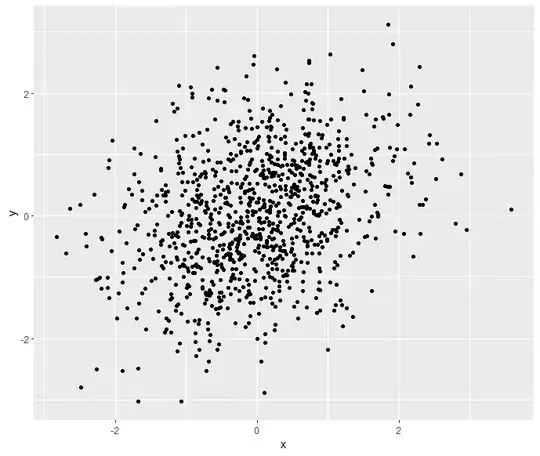
Let's simulate data with a weak correlation but no outliers

N <- 999 XY <- MASS::mvrnorm( N, c(0, 0), matrix(c( 1, 0.3, 0.3, 1 ), 2, 2) ) d1 <- data.frame( x = XY[, 1], y = XY[, 2], Set = "No Outliers Present" )

Check out the plot

ggplot(d1, aes(x = x, y = y)) + geom_point()

Tack on an outlier, say a giraffe (to borrow an idea from another answer)

d2 <- data.frame( x = c(XY[, 1], 99), y = c(XY[, 2], 101), Set = "Outlier Present" )

Check out the plot

ggplot(d2, aes(x = x, y = y)) + geom_point()

Fit linear regressions with and without the outliers

L1 <- lm(d1$y ~ d1$x) L2 <- lm(d2$y ~ d2$x)

Print summaries of the regressions and the data

R^2

summary(L1)$r.squared # I get R^2 = 0.09568171 without the outlier summary(L2)$r.squared # I get R^2 = 0.8828702 with the outlier

Total variance

var(d1$y) # I get a total variance in y of 0.9963245 without the outlier var(d2$y) # I get a total variance in y of 11.1925 with the outlier

Residual variance

var(resid(L1)) # I get a residual variance of 0.9496832 without the outlier var(resid(L2)) # I get a residual variance of 1.310975 with the outlier

Without the outlier, there is a weak but existent realtionship between the two variables.

without outlier

With the outlier, there is a much stronger relationship between the two variables.

with outlier

Despite the fact that the $R^2$ with the outlier is much higher, however, it has a higher residual variance. This is because the total variance is so much higher when there is an outlier. Just look at how much more spread out the data are when the outlier is included.

Dave
  • 4,542
  • 1
  • 10
  • 35
6

If removing the outliers increases RMSE but lowers MAE then that could suggest that the model was fitting outliers too closely. You could also check the distribution of residuals before and after removing outliers. If removing outliers increases variance in residuals, it might be that the outliers contain meaningful information. Likewise, if your data has a non-constant variance, removing outliers may have created an imbalance.

Kris13
  • 61
  • 3